July 24th, 2024
In a two-way tape like we are in, we are going to have bullish momentum days and bearish momentum days. For now, the sellers in NQ have momentum. Sellers in ES are gaining momentum. RTY is stalling, but the sellers do not have momentum.
How do we as day traders trade this type of market environment?
Small and smart. I continue to say in my notes to just pick a side that the market favors your strategy on each individual day and stick with it. Trying to pick directions throughout the day in this tape can work for those that are very active and have experience with their strategy trading two-way tapes. I personally prefer just finding a side to trade on (today that is short ES and/or NQ) and look solely for short signals on my short-term strategy. Keeps it clean and focused for me in my execution.
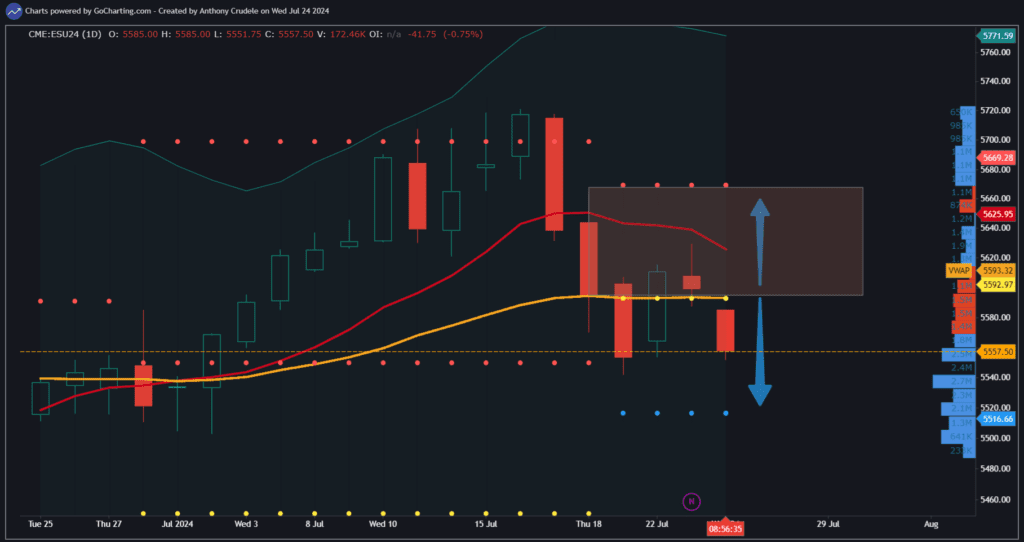
ES remaining below 5593 keeps me a seller of rallies and looking for a test of 5516 in the coming sessions. Daily closes below 5593 get me to look at swing shorts, not just intraday selling. If the bulls can regain 5593, I no longer look to be short. That area has multiple confirmations for me to be a pivotal area.
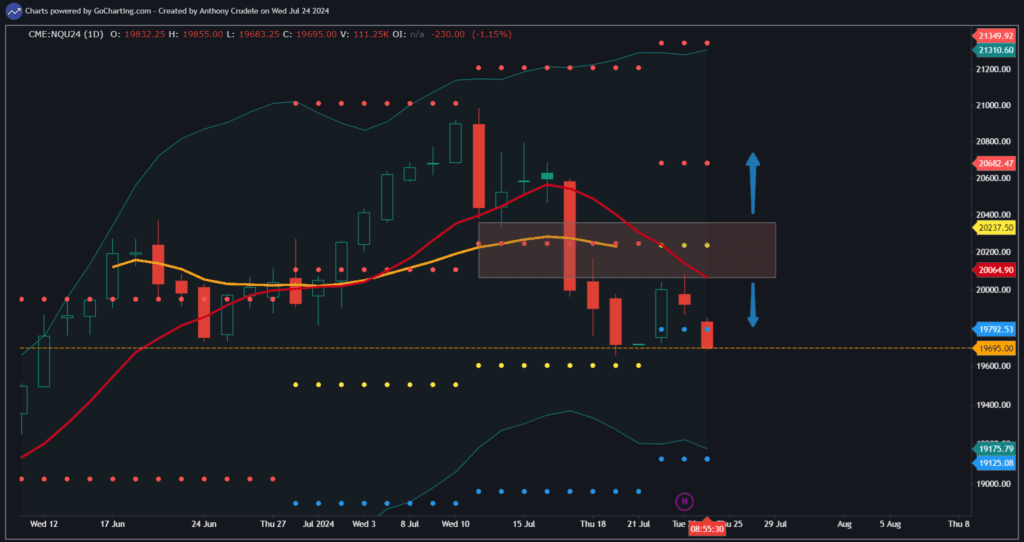
NQ looks the most bearish today as their daily Bollinger Bands are opening up and signaling range expansion. This means lower lows on the daily chart are likely in the near future and ranges are expected to get bigger. Good news for day traders as volume is expanding. NQ would need to regain 19,792 on a daily close for me to stop selling rallies.
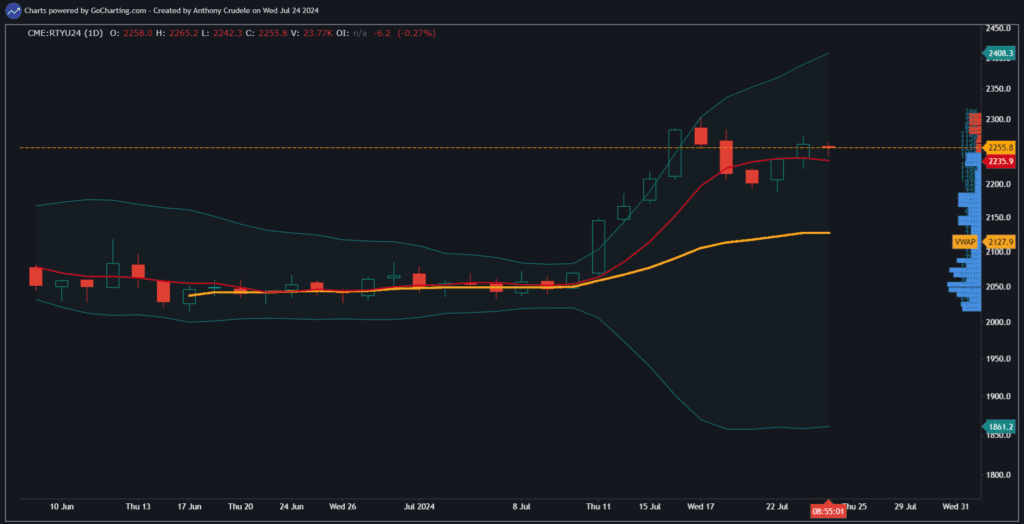
RTY is in a major chop zone. It looks like the rally has stalled and is just not ready to come back down yet. I don’t see any edge in this chart on the daily for direction. It can drift in either direction today.
Let the market come to you. Even though the bears have momentum, this is still a bull market. Don’t chase shorts.
Cheers, DELI
ES Chart https://gocharting.com/sh/3dd09810-ecee-485f-a601-c0c5fa3df027
NQ Chart https://gocharting.com/sh/ef2b162a-b6d0-484e-b3c2-8ab4b2f2de41
RTY Chart https://gocharting.com/sh/1be9377d-eef4-449d-8ce4-84ebb9d6db96
