Let’s strip away all of the technical indicators for a moment and just focus on one pattern: the broadening formation, AKA, the Megaphone pattern. It’s a pattern that used to show up on my worst trading days before I learned to recognize it. I’m going to share why this pattern gets most traders (and my former self) in trouble, and how learning to recognize it has not only improved my trading – but has also made it one of the most lucrative R-R setups when it comes to trading event contracts.
The broadening formation is a tricky pattern, marked by higher highs and lower lows. It usually shows up in those frustrating moments of market consolidation and conflict when the market is digesting price action and deciding what to do next. At the same time, impatient market participants are eager to force a trade in hopes of continuity in some direction. These traders tend to get chopped up.
Here’s why the price action associated with a broadening formation can be tricky:
1) Breakout traders fall into the trap of trying to ride every new high or low for some continuity, but instead, they’re faced with minimal follow through and often a swift reversal. Cue bear traps, and bull traps.
2) Between those expanding trendlines lies a lot of choppy, sideways price action that will lure undisciplined traders into forcing trades out of boredom and a desire to get the market to finally do something. The risk-reward is simply not there – and it will destroy your mental and monetary capital.
But here’s the good news: once you’ve trained your eye to recognize broadening formations, you’ll never be able to unsee them. What’s chaos for others becomes a goldmine for you as you learn to play the edges and sit out the price action in the middle. The favorable R-R on either side of the trendline has made this one of my favorite patterns, especially when trading event contracts.
Why I like Broadening Formations when trading event contracts:
I like to play event contracts on 1) event days, and 2) when I see moments of favorable R-R with potential for price to make a significant move. I like event contracts that are reasonably out of the money for a good R-R. For me that usually means going 2-3 strikes out for contracts that are between $20-$40, with the goal of closing in the money for that $100 payout.
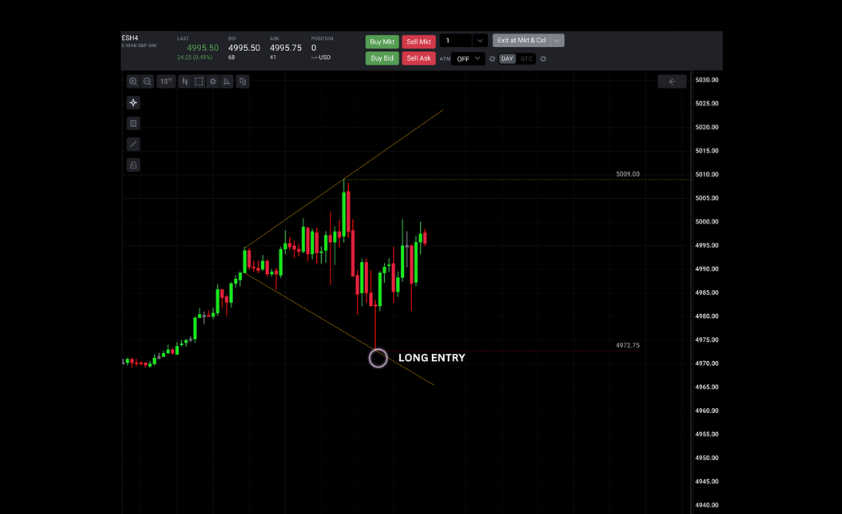
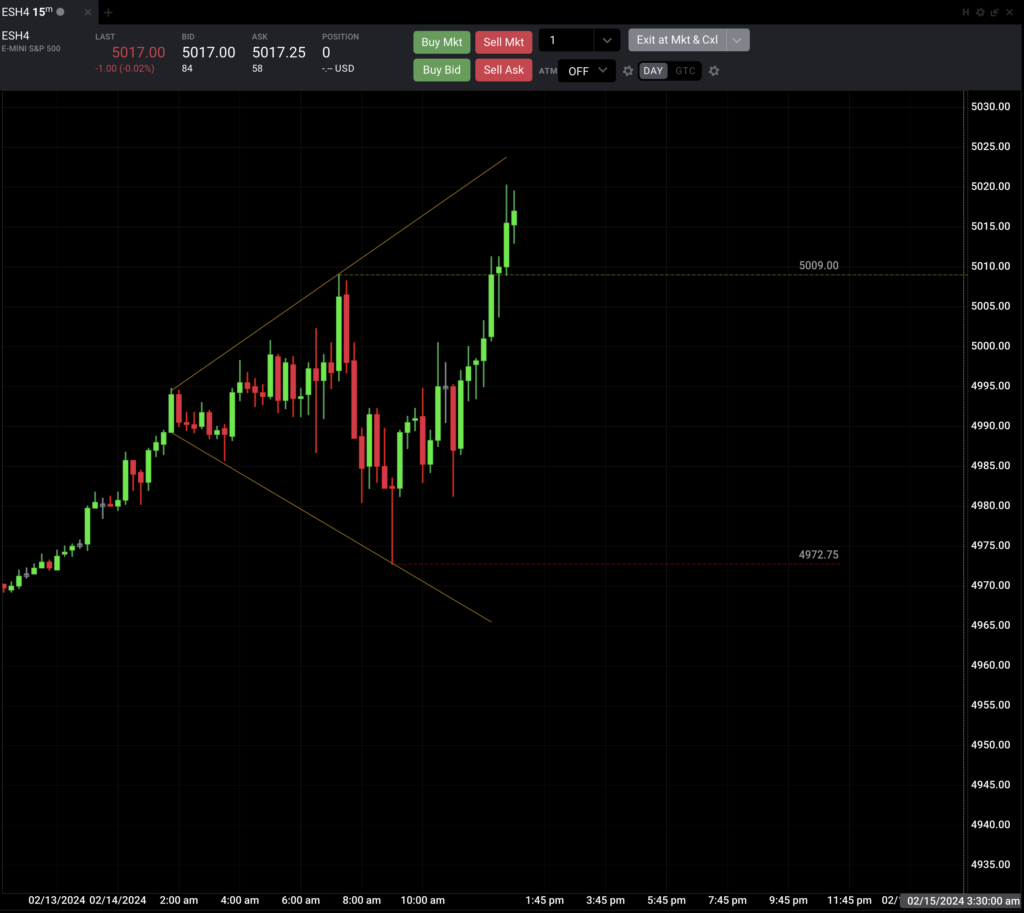
In the example below, you’ll see the expanding trend lines on this 15-minute broadening wedge on $ES showed really good upside potential once the LL came into play and bounced perfectly off of that lower trend line, resulting in a nice hammer candle with a long wick.
We made the previous high at 5009 and the new low at 4972.5, paired with expanding trend above confirming that we had potential for a significant move to the upside. In this situation, I would be targeting a higher high or a move back to the upper trend line. With that being said… since event contracts are based on the EOD close, I’d prefer to position into a closer strike like the 4990 YES as a midrange between the latest high and low in case price didn’t get a chance to move all the way back up in time. As you can see, you could have gone further out of the money to target that higher trend line with a more affordable 5000 or 5010 strike and the market still would have closed in your favor.

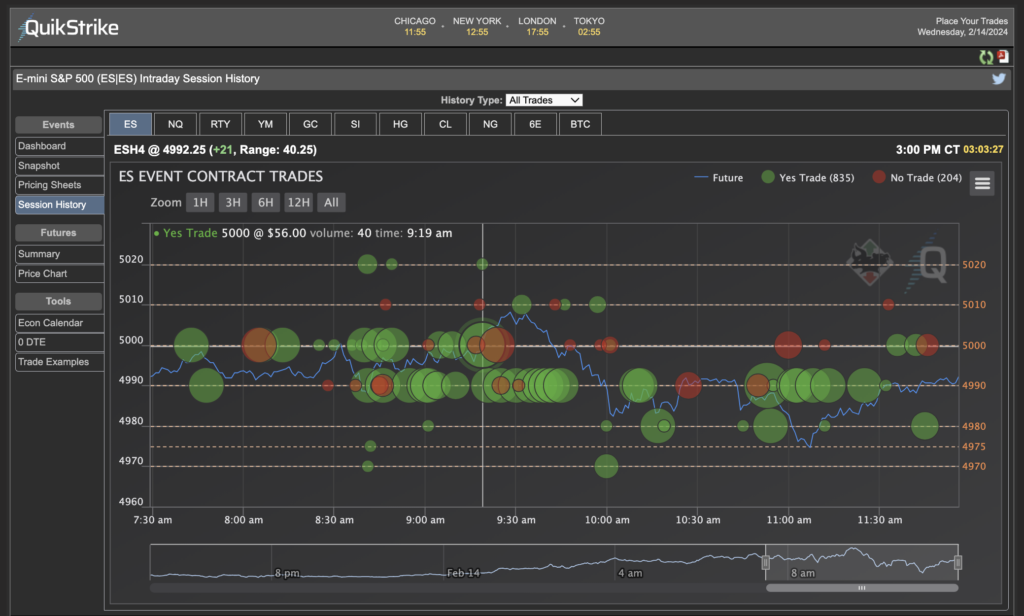
The Session History Chart on the QuikStrike options dashboard shows that the 4990 YES contracts traded at roughly $35 on that new low – resulting in almost 3x in profits with the end of day close successfully closing above that strike.
I like to have this chart pulled up while I trade, because it’s really useful when determining which strike to pick. Not only can you see what the other participants are doing, but it gives you a good idea of how the contract prices change based on the price of the market, and helps determine what a favorable R-R ratio is.
Here’s a chart specifically for the 4990 contracts:
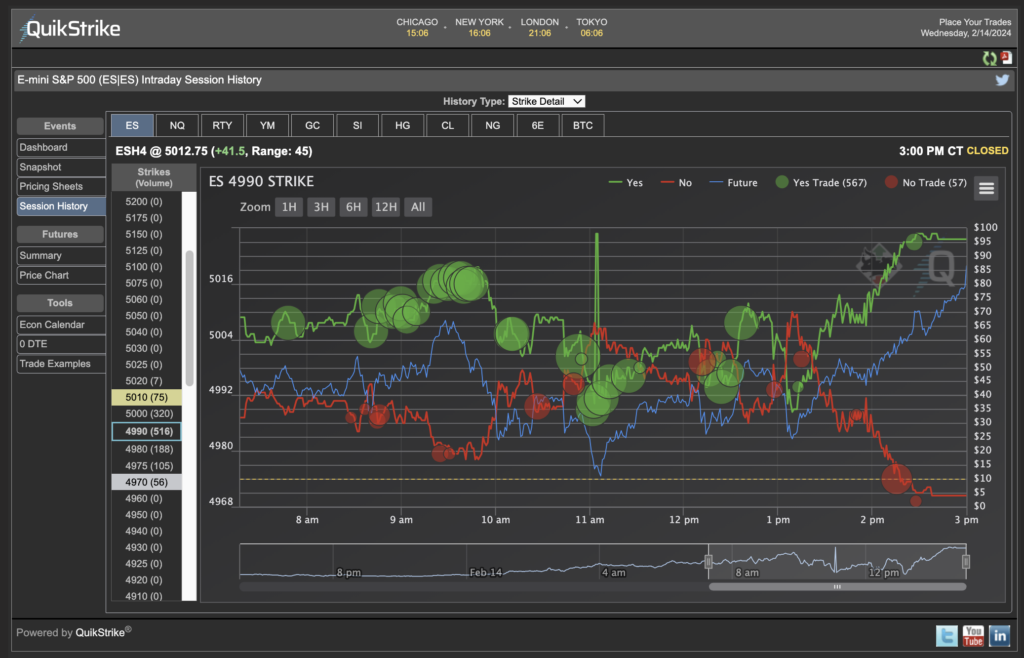
Here’s a chart for all of the ES contracts, showing that the 4990 and 5000 YES
contracts were being purchased all day: