October 16th 2023
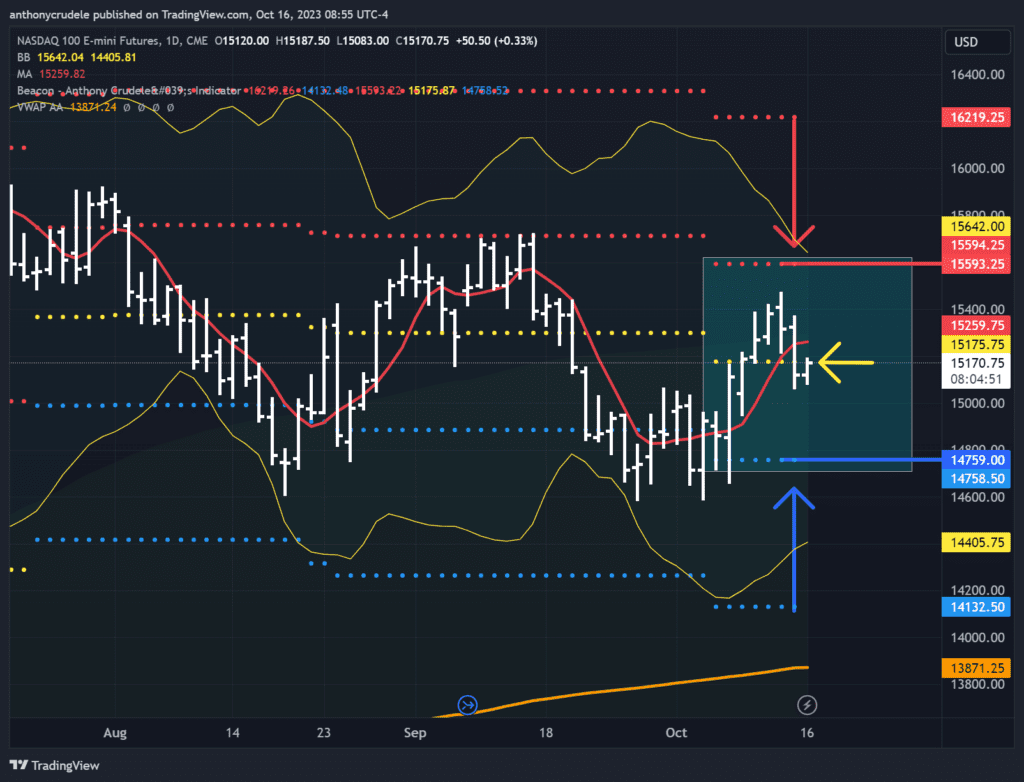
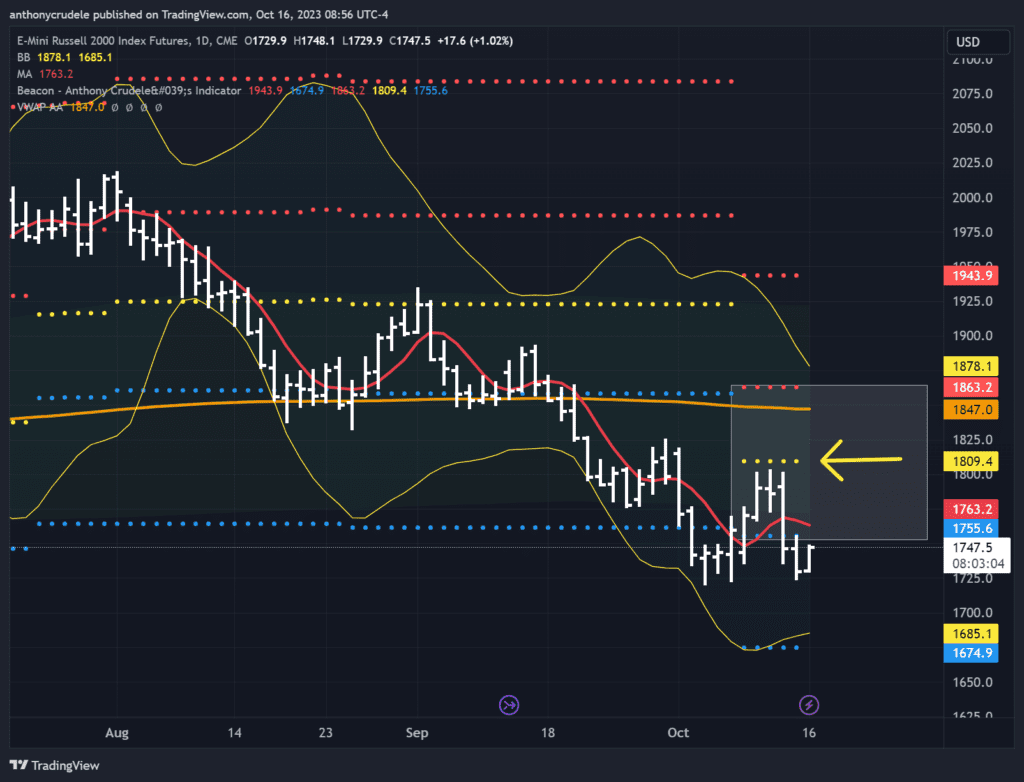
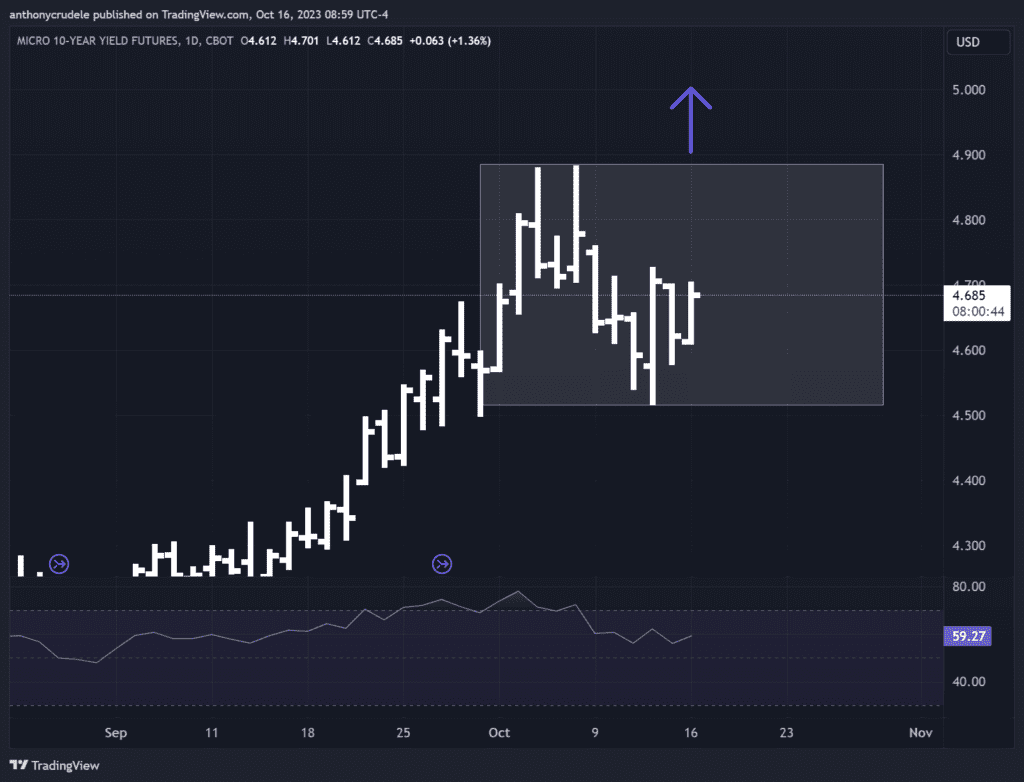
As the markets avoided a selloff on Sunday night due to a lack of headlines for the bears to push us lower, let’s turn to the charts and assess how the market is positioned for the day. First, let’s address the headwinds: the Russell 2000 weakness continues and 10-year yields are slightly higher. While these factors concern the primary bull market, they may not necessarily hinder a rally in ES this week. Why? Because the strength in the Nasdaq 100 outweighs the weakness in other areas of the market. The NQ acts as the upside leader, and the ES tends to follow the upside leader instead of the downside leaders.
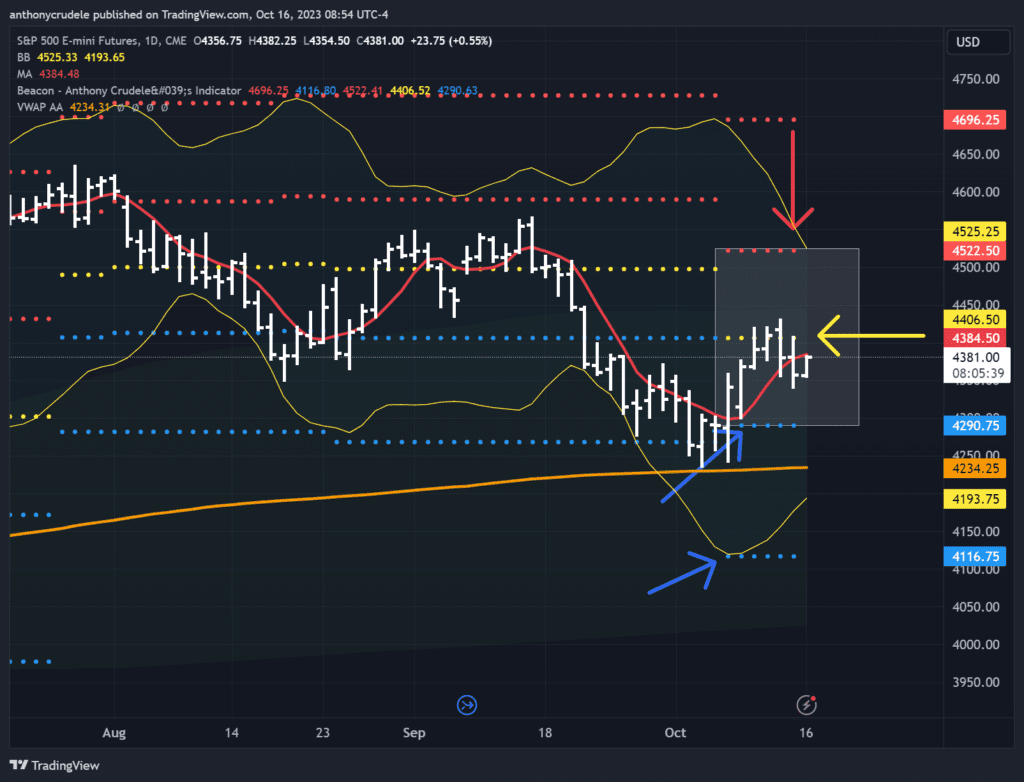
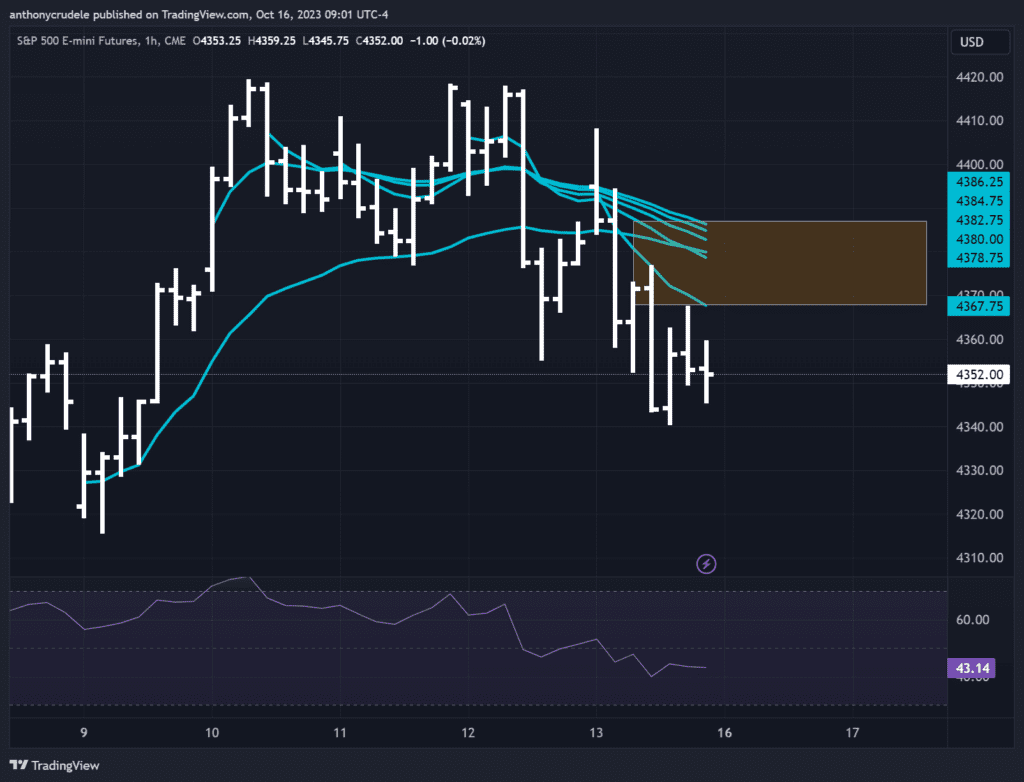
Now, let’s examine the technicals: the ES is just below its 5-day moving average (4384.25) and my neutral area of 4406.50. On the other hand, the NQ is sitting on its neutral area (15,175) and below its 5-day moving average (15,260).
Here’s my strategy: I’m keeping an eye on VWAPs from the previous week’s regular trading hours (RTH) opening bars, which range from 4385 to 4368. Expect some choppiness within this range. Initially, I’ll be looking to buy a dip near the 4368 area to test if the lower VWAP can hold. If it can’t, there’s a chance that the ES could experience a selloff towards the overnight lows. I won’t consider shorting unless there’s a significant breakout below 4368. Throughout the day, I’ll assess the market’s behavior before committing to a short position.
On the other hand, if the ES breaks out above 4385, we could witness a trend-up type of day, and I’ll be looking to go long with a potential test of 4406.50. It’s worth noting that a breakout above 4385 would bring us above all of last week’s VWAPs and the 5-day moving average. The NQ would likely be above its 5-day moving average as well.