November 17th, 2023
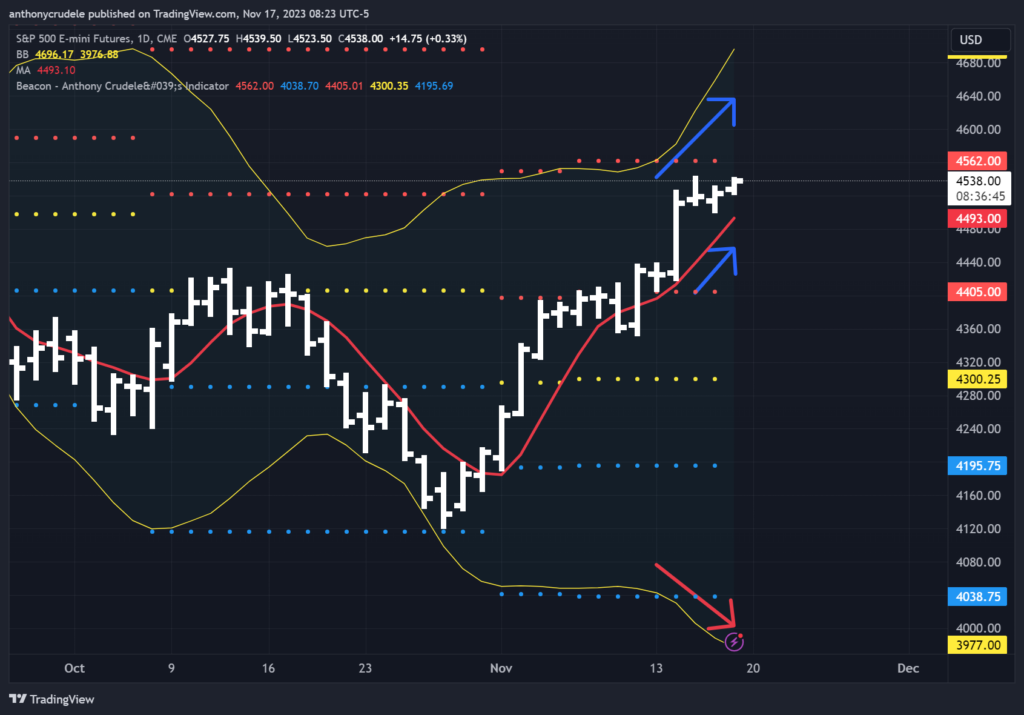
The bulls are resilient. The daily charts continue to indicate range expansion with Bollinger Bands expanding outward. We can’t even get the ES to come back and test the 5-day moving average. Yet, many bears on social media insist that this is just a bear market rally. But when we look at the market without bias, it appears incredibly strong.
Traders often claim that the sharpest rallies occur in bear markets. I have observed that this particular comment appears to be more of an attempt to showcase intelligence rather than providing substantial value. Firstly, the biggest and sharpest rallies always follow a low point, which naturally comes after selloffs. Secondly, let’s examine this year so far. The NQ and ES have already seen double-digit percentage gains before the pullback, which was subsequently bought extensively.
Personally, my favorite trading setups are pullbacks in a bull market when all the indexes show consistent patterns. That’s when we witness the strongest moves. And this current move isn’t just sharp; it’s exceptionally strong.
Of course, things can change in the future, but for now, my trades this week serve as the best report card for the market. I took three short positions and one long. Out of the shorts, I lost on two, made a small profit on one, and my biggest winner was the long position. The fact that I’m not finding success with shorts is the most valuable feedback I can get from the market.
No trading for me today as I head out for a two day golf tournament at my club down here in Naples, FL, but my plan for the day would be the following:
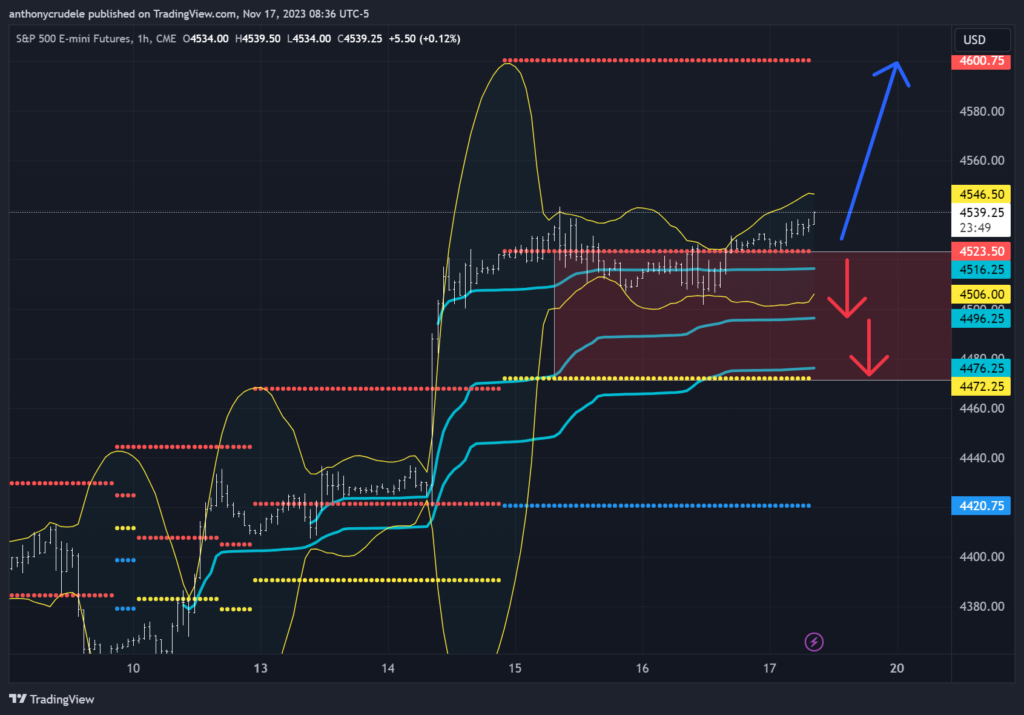
ES: 4523.50 is the pivot for today. If we can get hourly closes above that area, I think we’ll grind higher. It’s probably a tough trade, to be honest, because NQ and RTY are still in sell zones on their 60-minute charts. My bigger picture target is 4600, and as long as we can sustain trading above 4523.50, I believe that’s where we’re headed in the coming sessions. However, if we fail to hold above 4523.50, it could be a bumpy road down to the VWAPs shown in the charts and eventually down to 4473.
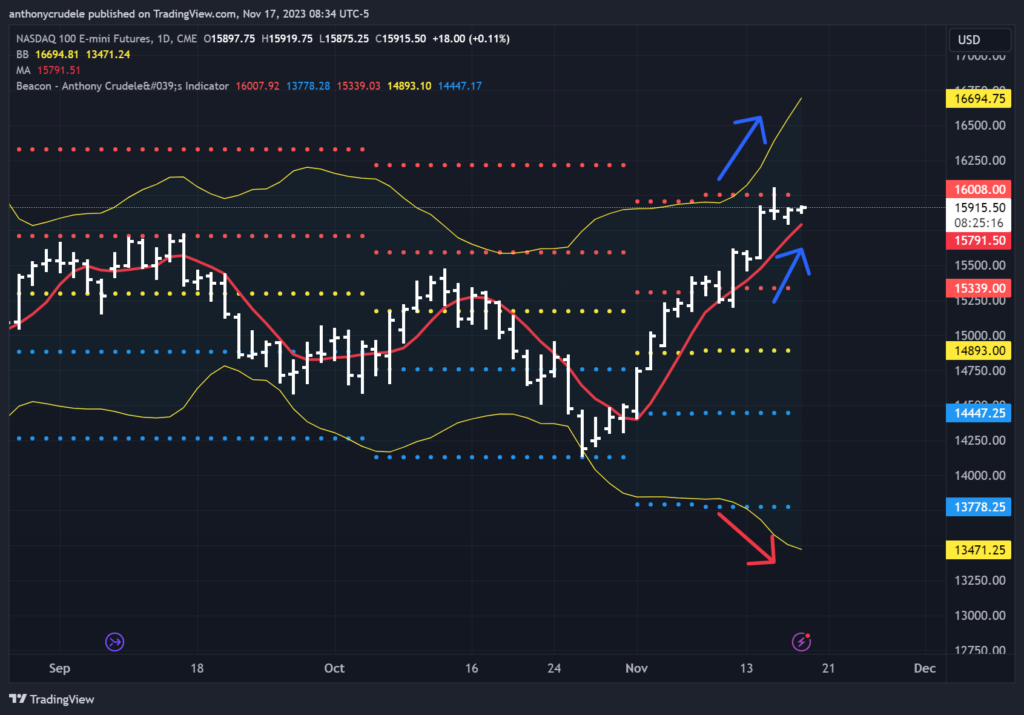
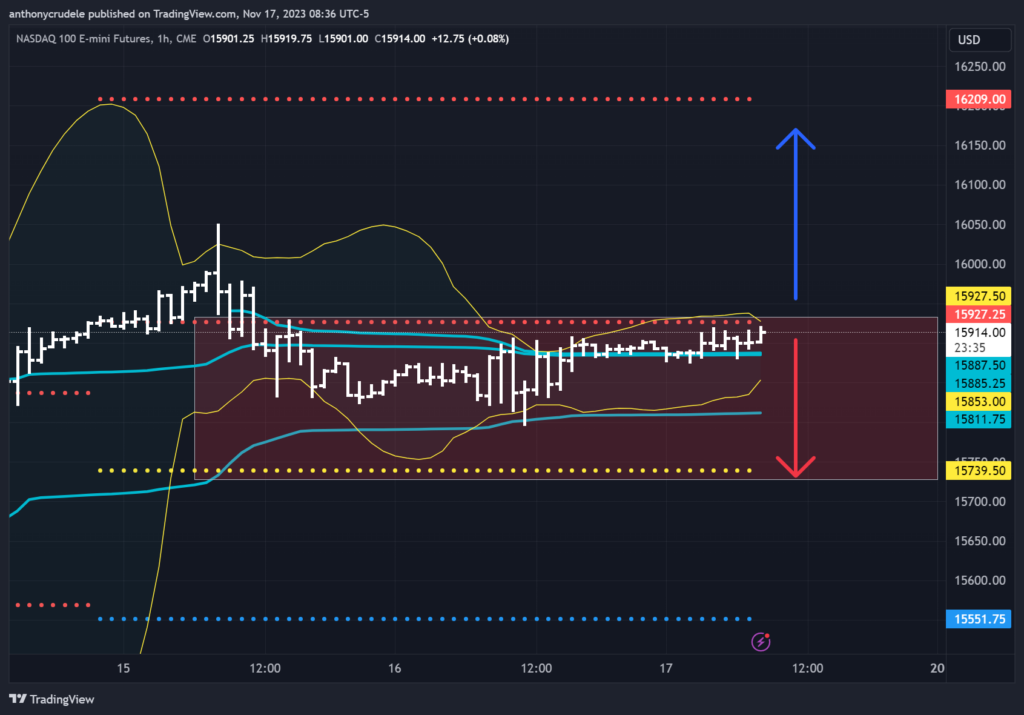
NQ: Still boxed in a sell zone on the 60-minute chart, but the daily chart is very bullish. As long as the NQ remains below 15,927, it could drift lower and test 15,739. However, if we get an hourly close above 15,927, then the market sentiment turns bullish and we can grind higher. This would be a significant boost for the ES as well.
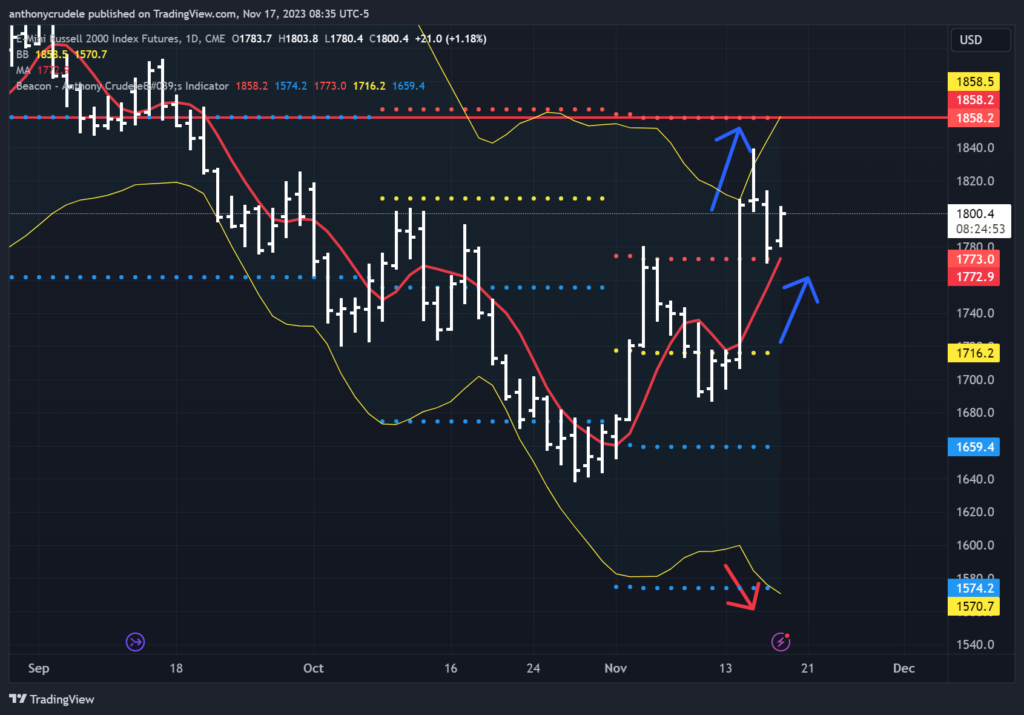
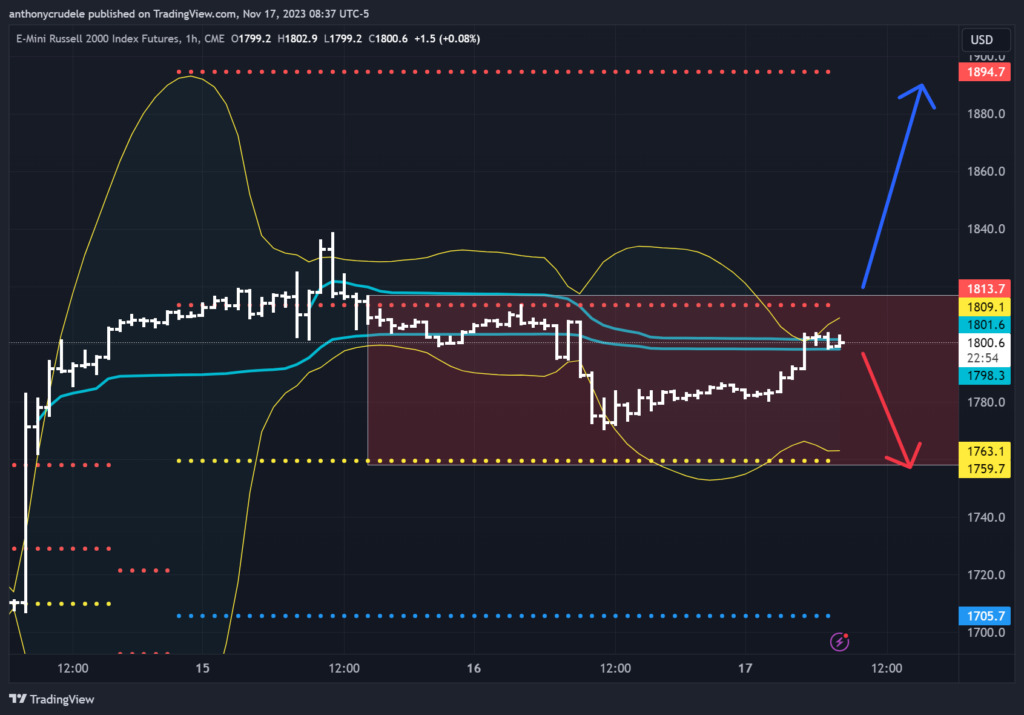
RTY: Similar to the NQ, it is boxed in a sell zone on the 60-minute chart, but the daily chart is bullish. As long as RTY remains below 1816-13, I believe it can test 1760. RTY favors the short side until we get that hourly close above 1813, then the market sentiment shifts back to bullish and we can grind higher. This would uplift the entire market.
Have a wonderful weekend!!! Cheers, DELI