November 6th, 2023
The bulls have the momentum, and it looks like we could see another leg higher this week. I know traders are talking about the market slowing down after last week’s rally, which makes sense considering where we came from. However, sometimes our past inhibits us from envisioning where we can go next. Big rallies and selloffs always make traders skeptical, but as a trader, you have to put that hidden bias away and evaluate the current situation.
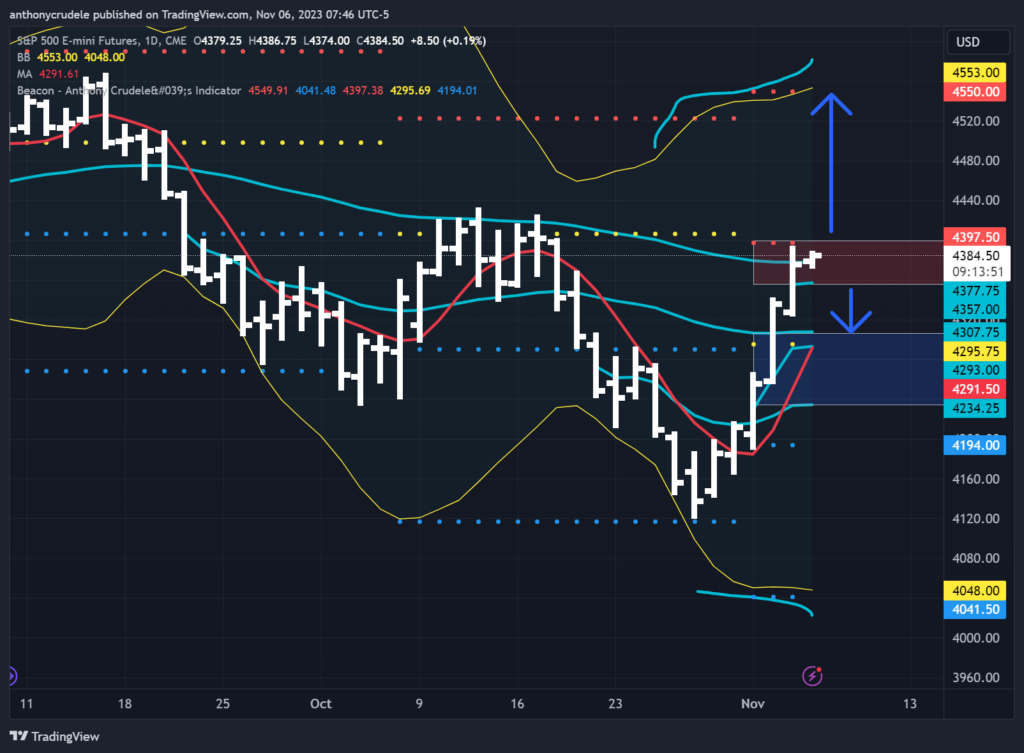
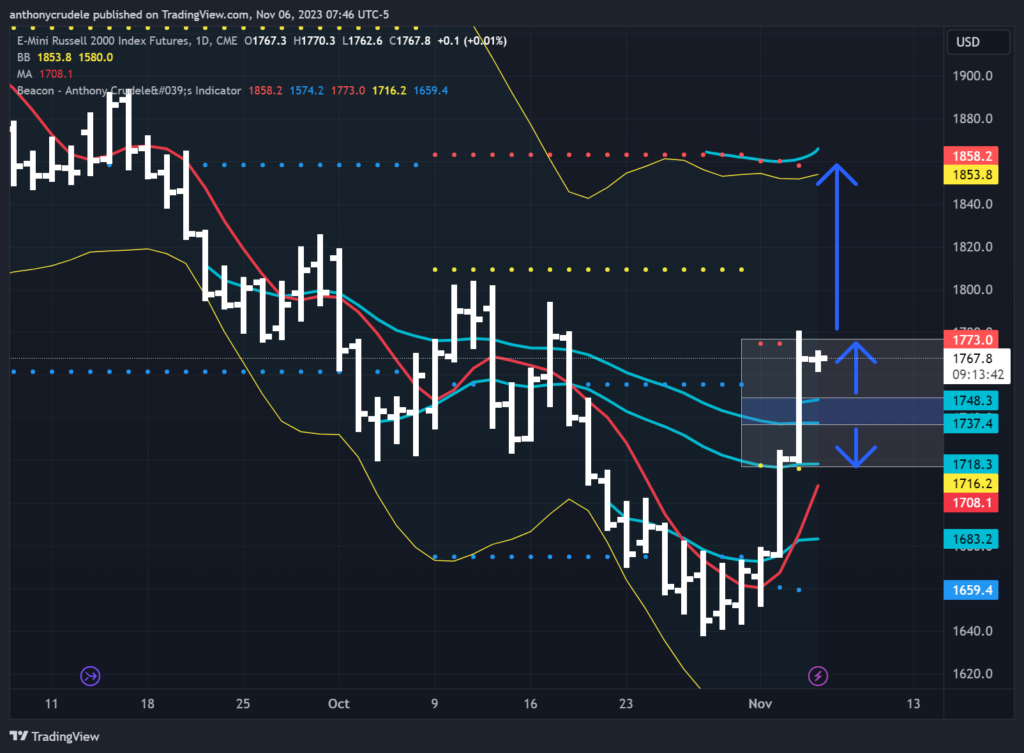
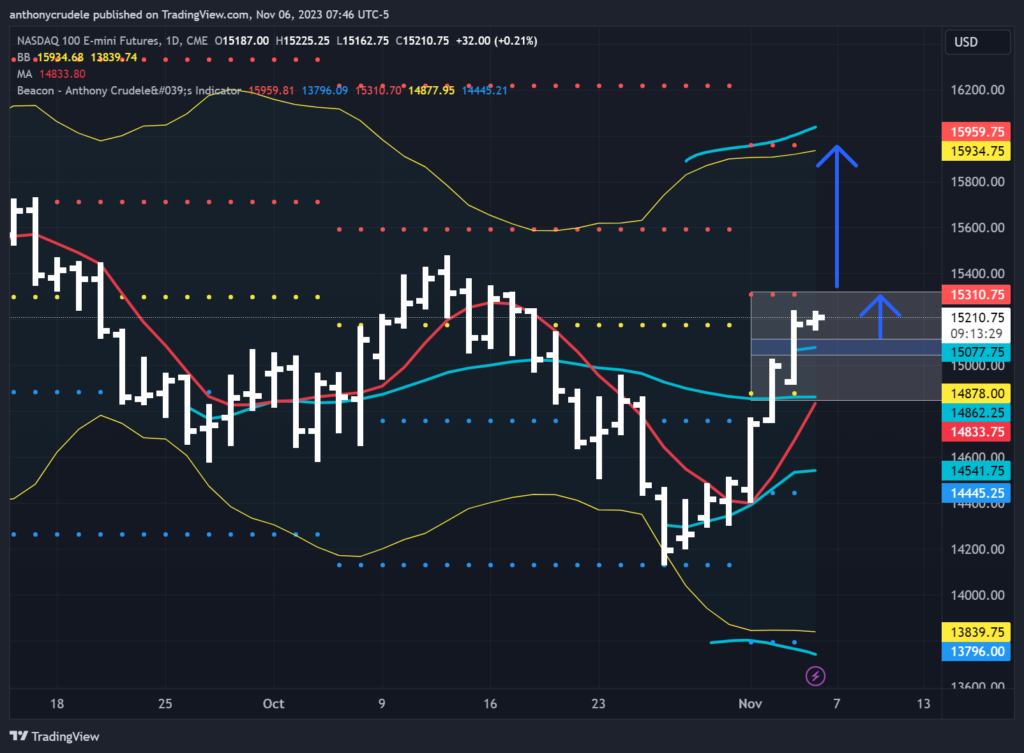
When I look at the charts right now, I am as bullish as I was at the end of last week because they support it. Let me explain why I remain so bullish. First, look at the daily charts in RTY, NQ, and ES. We are above all of my anchored VWAPs, above the 5-day moving averages (and they are pointing upward), and the daily Bollinger Bands have begun to open up and point outward. It’s rare to see daily Bollinger Bands pointing outward after a move lower, then flatten out, and quickly start to point outward on a rally. Most of the time, after a move, the Bollinger Bands move inward. That’s not the case right now. The Bollinger Bands pointing outward indicate range expansion, suggesting that the move higher is not done yet.
Now, let’s talk about key levels to watch. In ES, keep an eye on 4397.50 as initial resistance. If the bulls can push above there and get a daily close above there, we might see 4550 in the coming weeks. On the downside, watch the 4357-60 area as key support. If that area doesn’t hold, my tone could change, and we could push down to 4308.
In RTY, key support is at 1748-38. As long as that holds, I’m keeping an eye on 1773 as resistance, which will eventually be broken. If we push above 1773, a test of 1850 could be possible in the coming sessions. If 1738 doesn’t hold, my tone would change, and we could push down to 1718, which will be a significant level for the bulls and bears.
For NQ, I’ll be watching 15085-75 as key support today. If we can hold above there, I see a test of 15310. 15310 will serve as initial resistance that will be broken, and then we could we could be headed towards 15900-16000. If 15075 fails to hold, I change my tone and we could be headed for a test of 14900-14850, which will be a line in the sand for the bulls/bears.
I’m buying the dips until proven wrong. I’m only looking at the long side until proven wrong. Trimming long positions to get small and trail for higher targets. I’ll use my 3-minute opening range strategy with AVWAPs to help guide me. Small and smart. Have a great day.
Cheers, DELI