November 28th, 2023
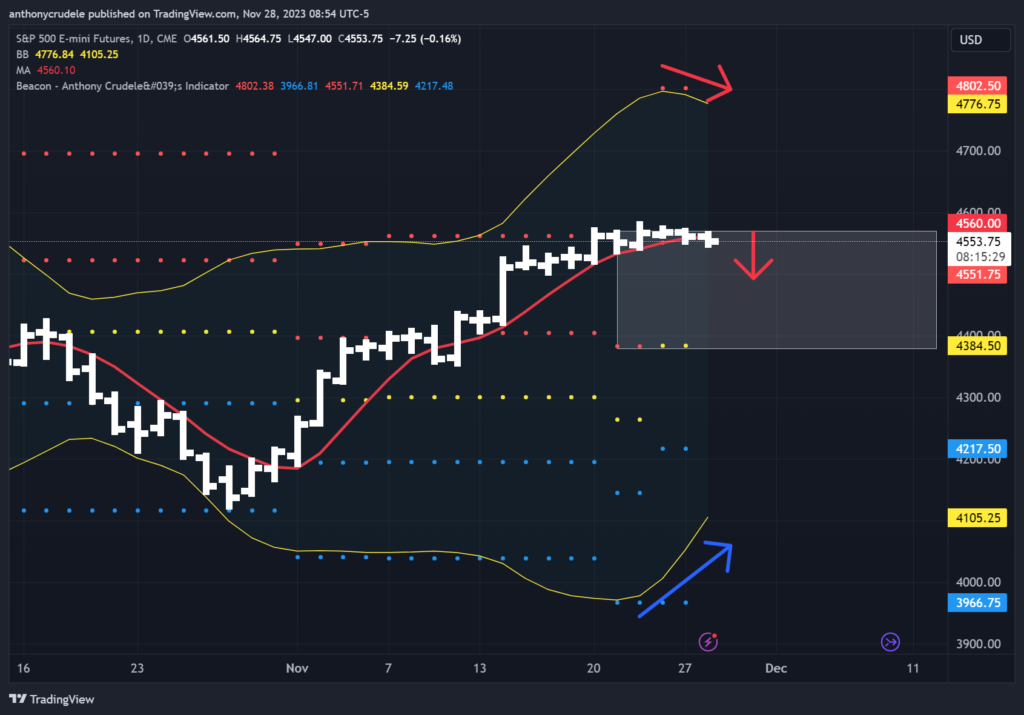
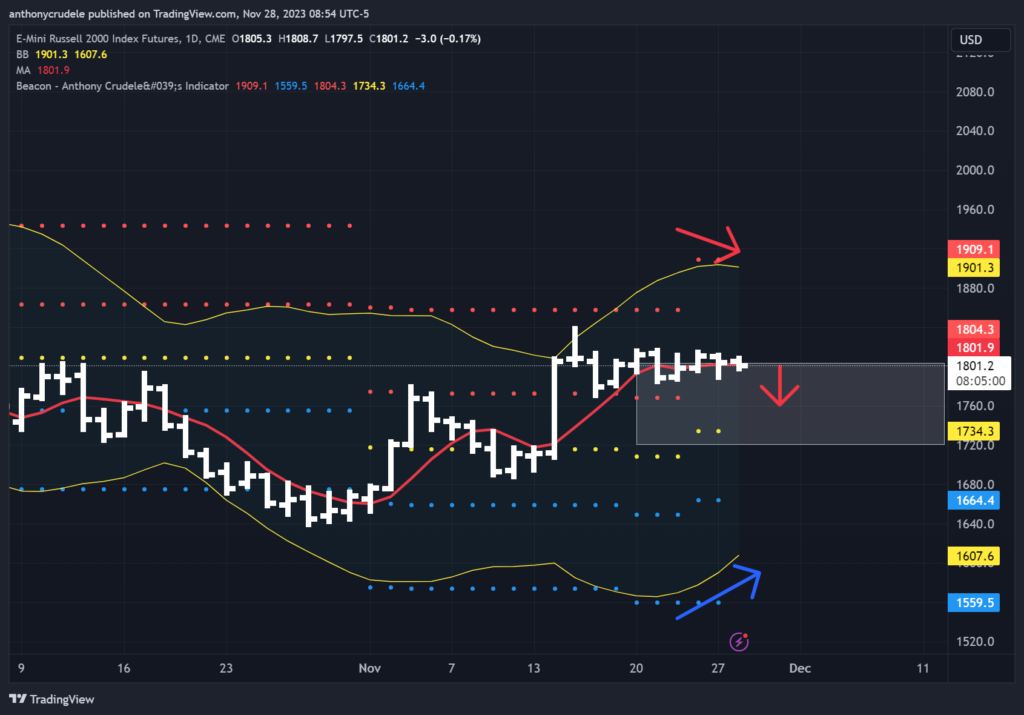
Market stalling. When a market starts to stall in a trend, it will almost always start to show signs of mean reversion, and that’s what we’re seeing right now in the US Indexes. The 5-day moving averages have caught up to current pricing, and the daily Bollinger Bands have started to move inward, indicating a slightly bearish tone. This is one of those times where you have to look beyond the charts and take other factors into consideration.
Pure technical analysts believe the charts are always right, and although it’s hard to argue with that type of thinking, as a trader, I understand that there are environments where signals don’t work as well. I’ve battled the markets too many times, trying to force my will upon the next move. I never win those battles, and I come out mentally and physically exhausted, with less capital.
So, how do I approach a tape that is showing signs of weakness only because the markets have stalled? Small or not at all.
Here’s my plan for today:
I’ll watch the 3-minute opening range and observe how the market trades around it. I will draw horizontal lines on the 3-minute RTH opening bar’s high and low, and anchor a VWAP to it. If the AVWAP starts to push below the opening range low, then I think we could see a slight trend down day. I’m not expecting much to the downside in this tape, but it is tradable for a small move. On the other hand, if we see the VWAP get above the opening range high, then maybe a trend up day, but once again, I have minimal expectations of a strong move. If the VWAP stays between the opening range high and low, I’ll stay away from this day like it’s the plague.
In this tape, it’s important to be small and smart. Don’t exhaust yourself mentally, physically, or in terms of capital until the picture is clear. Until then, keep it light and tight. Cheers, DELI