October 12th 2023
The CPI numbers are out, and now it’s time to see how the market reacts. Rates are flat on the long end and slightly up on the short end. This shouldn’t have a major impact on stocks, but it’s still worth keeping an eye on them throughout the day. Speaking of technicals, let’s take a look at the ES chart.
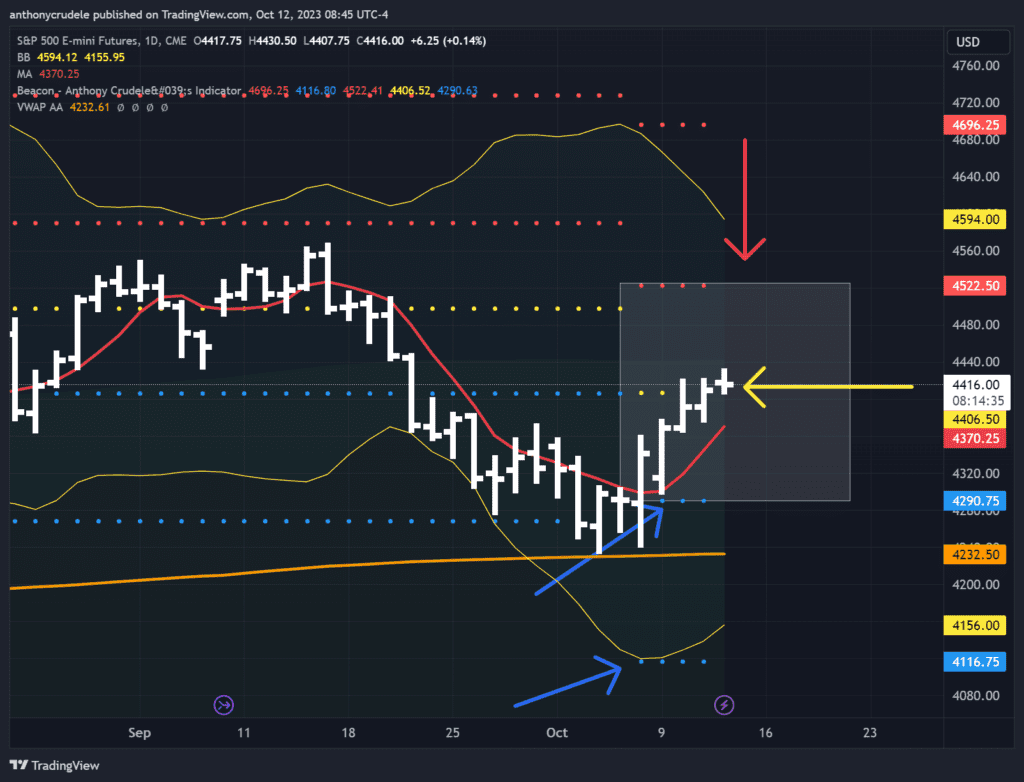
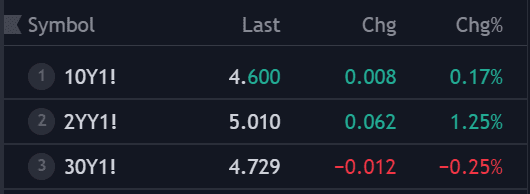
The daily chart remains bullish as we continue to hold above the 5-day moving average. We closed above my neutral area of 4406.50, which suggests a possible test of the 4522 area if we consistently close above 4406.50. The NQ, being the upside leader, gives us more confidence in the bullish case for ES as it’s further along to its upside target of 15,593.
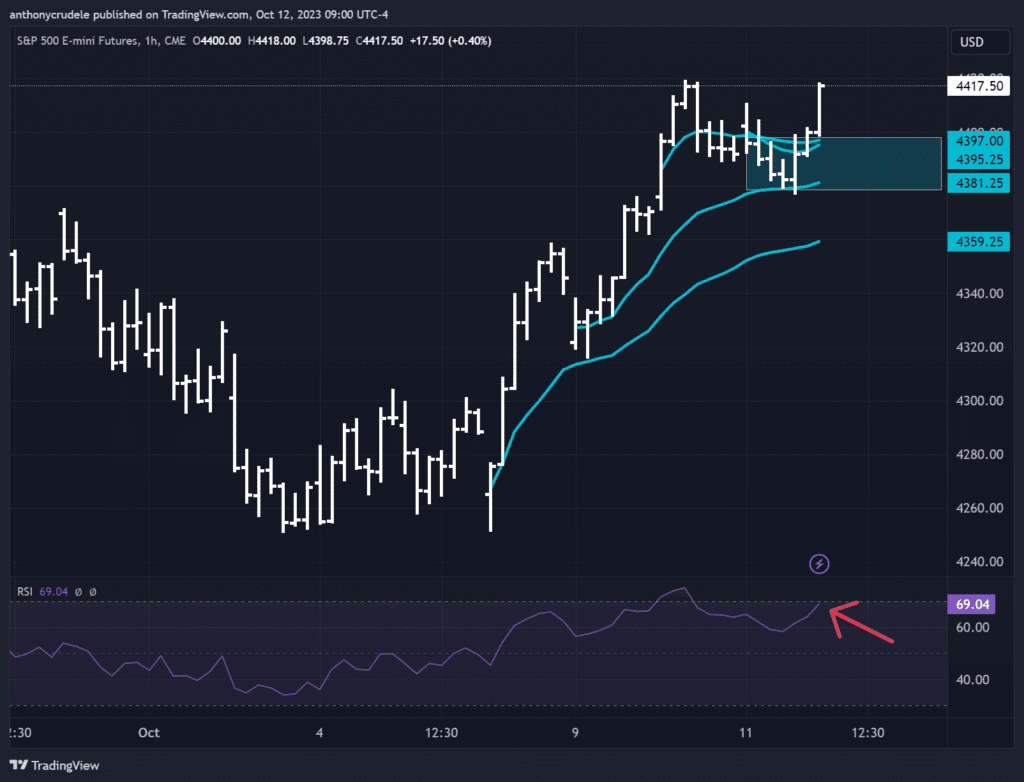
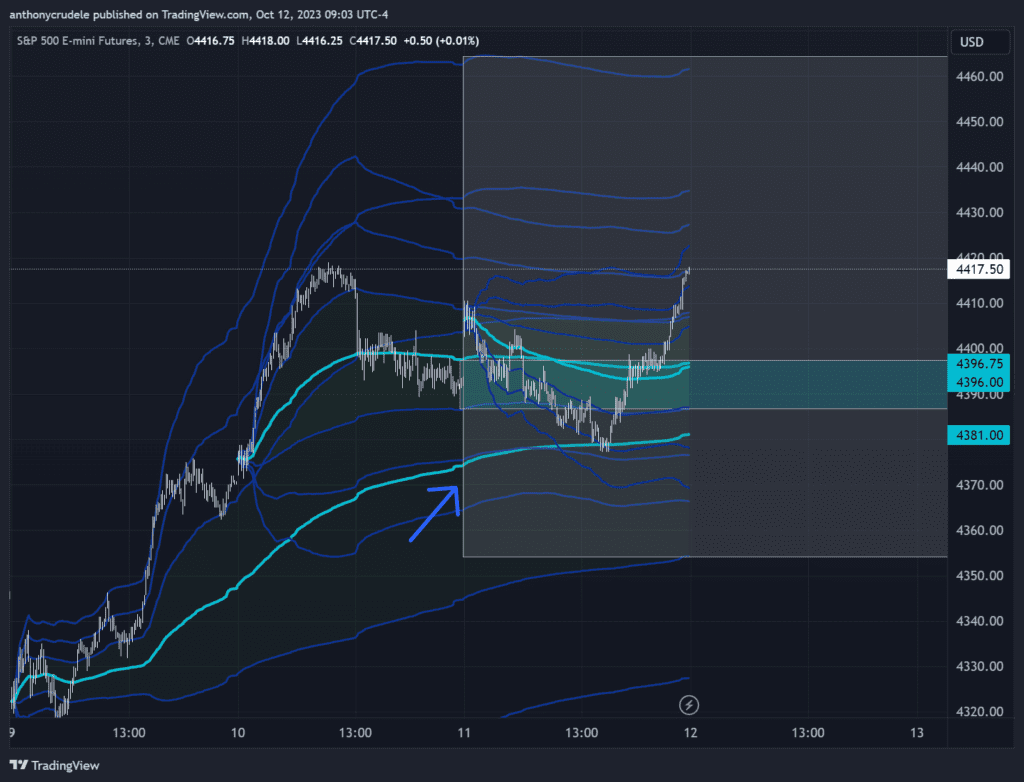
For today’s strategy, check the 3-minute and 60-minute RTH charts for the week. We have a couple of VWAPs around 4397-4395, along with some standard deviation lines. Bulls need to sustain that area in the morning session to keep the momentum. I’ll be looking at longs using futures and options on futures, potentially entering just in front of that area as a precaution. However, if we fail to hold that level, it could bring a test of 4381 which is key for maintaining bullish momentum…failure to hold that could bring back some real sellers.
As for upside targets, keep an eye on the standard deviation lines around the VWAPs. Currently, we’re looking at a possible stall around the 4435 area. If ES pushes above that, it could open the gates to a test of 4460ish. These levels may change throughout the day, and I’ll report back as I see any changes.