This last week was obviously all about CPI
So, let us dive into this a bit
Let us start on Monday…..when…
Bloomberg reported :
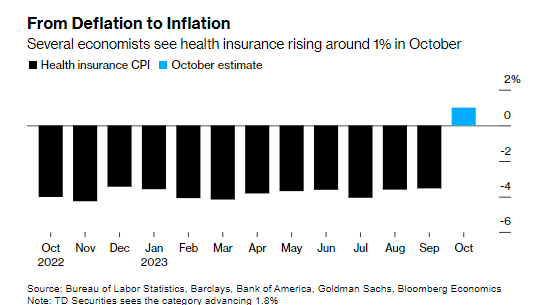
Health Insurance Is About to Boost US Inflation After Months of Relief
A change in how the government estimates health insurance costs is expected to give a slight boost to a popular US inflation measure, reversing a trend that had been providing some relief in recent months.
Beginning with Tuesday’s release of the October consumer price index, the Bureau of Labor Statistics will roll out a few changes to how it tabulates the category. In addition to a routine change in source data, the new methodology will aim to smooth some of the volatility and reduce time lags in the index.
After being a reliable drag on overall inflation for the past year, the new computation is widely anticipated to put upward pressure on the headline CPI, at least in the near term. It’ll also boost a narrower subset of services inflation that excludes energy and housing.
So what happened on Tuesday to the healthcare insurance metric after the numbers were released?
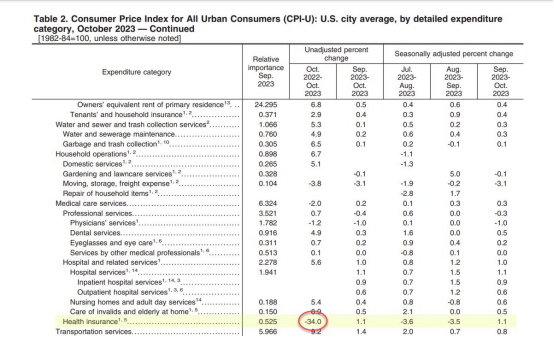
Healthcare -34% which caught the market completely off guard and basically accounted for almost the ENTIRE unexpected drop in inflation.
Indicies and bonds flew (yields tanked) and never looked back the entire week.
So how did economists get this so wrong?
According to the BLS…here are the change in methodology
Changes to Health Insurance Methodology
Following recommendations from the National Academies of Science, Engineering, and Medicine’s Committee on National Statistics (CNSTAT), the BLS is improving the methodology used to calculate
retained earnings in the CPI health insurance index. Under the pre-October 2023 method, retained earnings were updated annually without any smoothing of the data. Under the new method, the BLS will update retained earnings every 6 months using half-year data and will calculate a 2-year moving average to smooth the changes in retained earnings. Beginning with the publication of October 2023
data, there will be a 6-month transition using annual data that has been averaged (smoothed) over 2 years. In May 2024 (publication of April 2024 data), we will begin to incorporate half-year, rather
than annual, retained earnings. After this date, the retained earnings will be updated every 6 months with April and October data which will be released in May and November, respectively. This change in
methodology will reduce the time lag associated with the health insurance index by 6 months.
So for some reason, no one read the part where the metric is based on company EARNINGS, not what you actually pay. Everyone who is paying health insurance is hyper aware that rates have gone up over 30% over the last three years, at least, in some cases more.
COMMENTS: The market only looks at headline numbers, and not if we have revisions later, so regardless if you think this data is suspect or not, the market has already spoken.
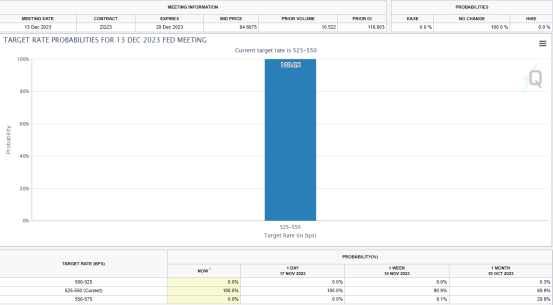
CPI
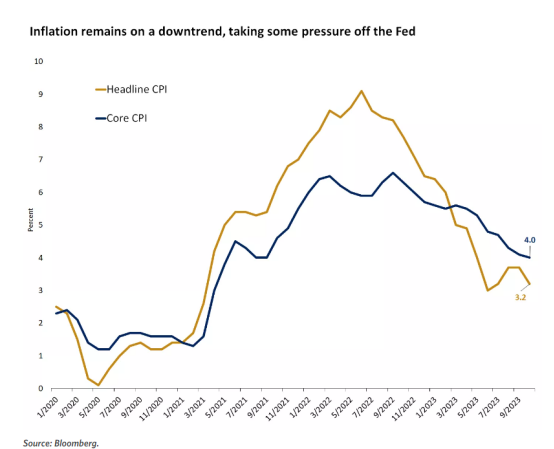
The market started factoring in Fed rate cuts much earlier
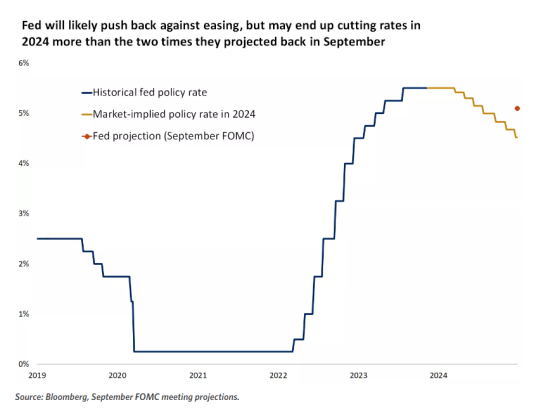
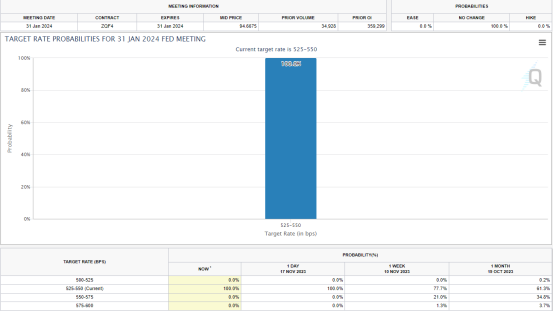
CME Fed watch tool is now at 100% pause for December and January meetings – keep an eye on this, if they actually do raise, this will send the market into a tizzy
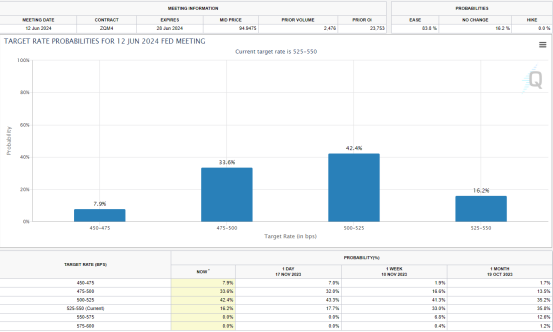
And has significantly increased odds of a rate CUT starting in June 2024 ..despite Powell saying higher for longer
CRUDE OIL DECLINE
I spoke about this on Fox Business on Monday
And on Friday for Complete Intelligence HERE
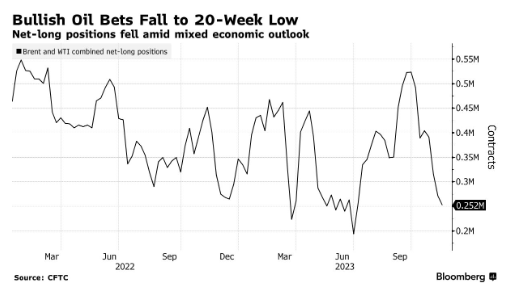
The OPEC Monthly report came out last week, and confirms what I have been saying for weeks:
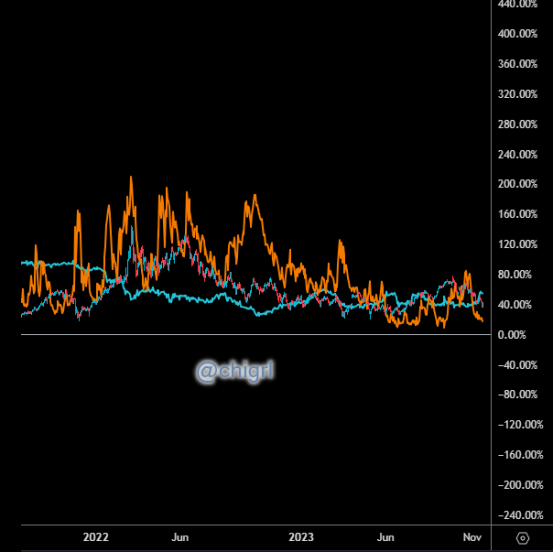
Despite the above healthy and supportive market fundamentals, oil prices have trended lower in recent weeks, mainly driven by financial market speculators, as they have sharply reduced their net long positions over the month of October, compared to the late September, particularly in the NYMEX WTI futures and options contracts. In fact, data shows that hedge funds and other money managers have heavily cut their bullish positions over the month of October, selling an equivalent of 161 mb and 43 mb of NYMEX-WTI and ICE-Brent futures and options contracts, respectively. In total, they have sold an equivalent of more than 200 mb of oil since late September, or about 37% of total bullish positions. This has fuelled market volatility and accelerated the price decline
This long liquidation has continued into November
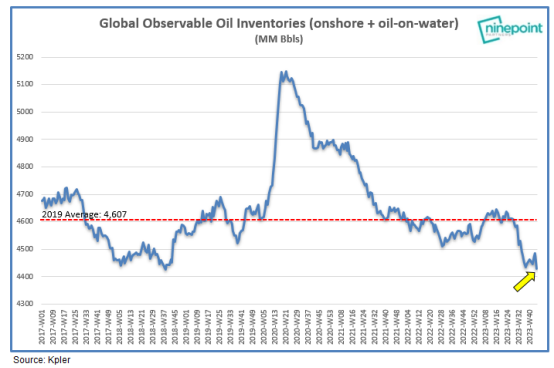
Meanwhile…global inventories continue to decline
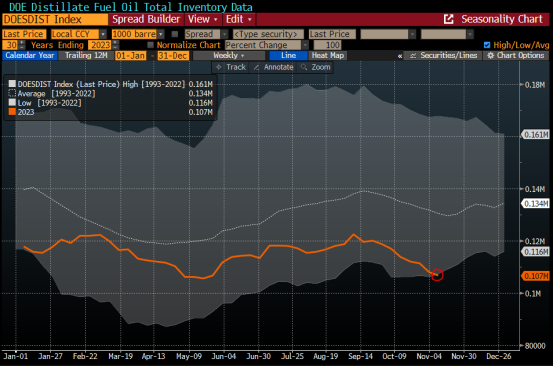
More concerning is a chart pointed out by Javier Blas this week that shows that US stocks of distillate fuel (diesel and heating oil) are ending the fall season at their lowest **seasonal** level in data since 1982
Why is this happening with fundamentals remaining ridiculously strong?
Perhaps its in the the market data
When we have a VIX crush, oil pukes and tech explodes
(again I talked about this on Monday on Fox Business…see video above)
We have an OPEC meeting this week on the 26th, consensus is that they will carry cuts into 2024. Keep an eye on this as this meeting is on a Sunday before the US futures markets open.
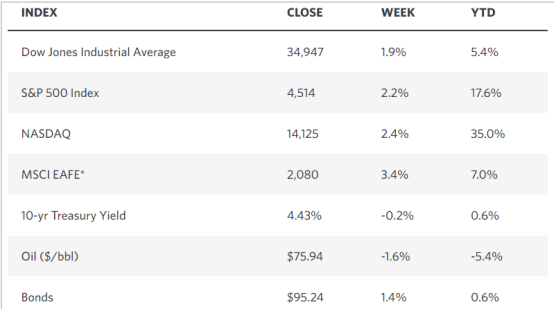
MARKET STATS THIS WEEK
TECHNICALS
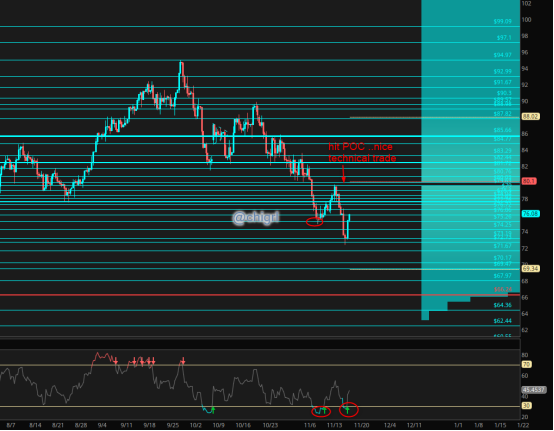
Crude Oil
Talked about this enough…here is the chart
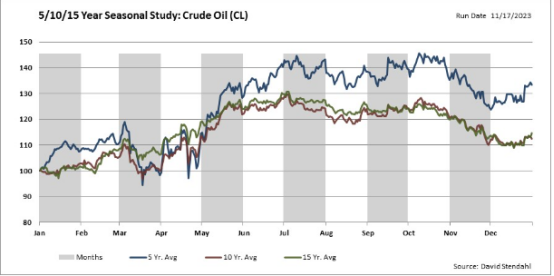
Crude Seasonal Chart
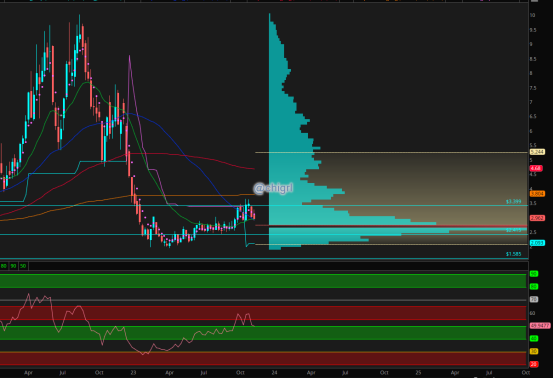
Nat Gas
This market is back in consolidation. BUT above the stagnate market for most of this year.
Again, I think this best play for this market are equities rather than futures or ETF’s.
I remain long two companies that have solid production and distribution capabilities in the US
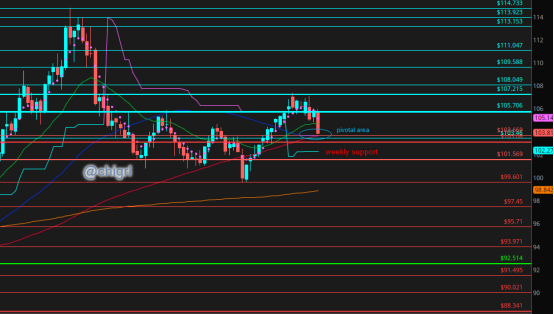
Gold

Silver
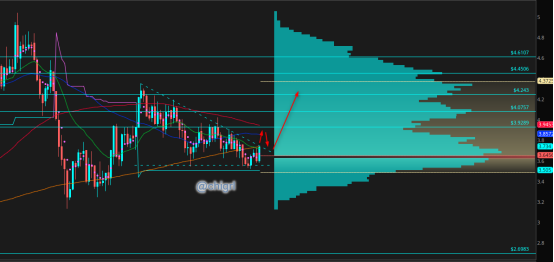
The wild child…I remain bullish
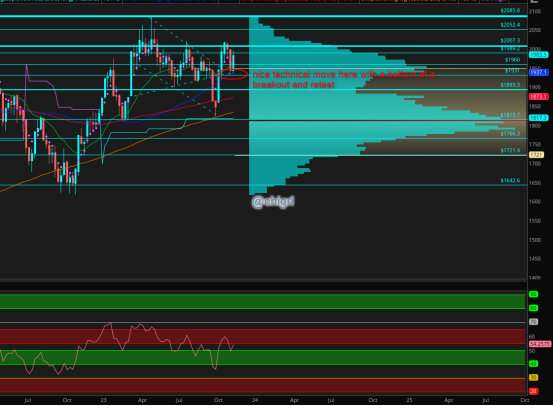
Copper
Weaker dollar and problems in Panama helping to boost copper this week, but from a technical standpoint I would love to see a breakout and retest
USD $DXY
Financial Disclaimer: This material has no regard for specific investment objectives, financial situations, or particular needs of any user. Nor should any of its content be taken as investment advice. The views expressed here are completely speculative opinions and do not guarantee any specific result or profit. Trading and investing are extremely high risk and can result in the loss of all of your capital. Any opinions expressed here are subject to change without notice. We may have an interest in the securities, commodities, and/or derivatives of any entities referred to in this material. We accept no liability whatsoever for any loss or damage of any kind arising out of the use of all or any part of this material. We recommend that you consult with a licensed and qualified professional before making any investment or trading decisions.