THIS WEEK WAS ALL ABOUT YIELDS
Via Bloomberg:
Wild Treasuries Swings Just Starting as Bond Traders ‘Buckle Up’
A surprisingly strong US economy and mixed signals from the Federal Reserve have fueled some of the wildest swings in Treasuries in recent memory. Add geopolitical angst and a surge in debt supply and you have a recipe for sustained volatility for months to come, market watchers say.
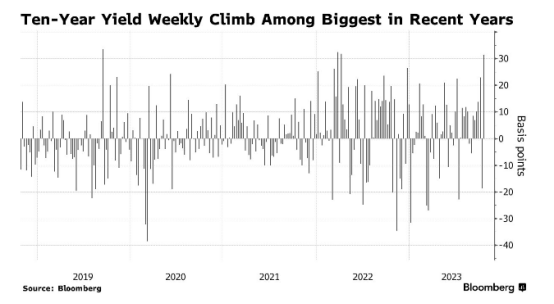
Dubbed the “world’s safest asset,” Treasuries have proven anything but recently as dramatic moves in yields become an almost daily occurrence. Just this week, the rate on the 10-year swung in a range of almost 40 basis points, buffeted by crosscurrents including resilient retail sales and jobless figures, a bevy of comments from Fed officials and rising demand for haven assets amid concerns of an escalating conflict in the Middle East.
“It’s going to be a rough ride, so buckle up,” Mike Schumacher, head of macro strategy at Wells Fargo Securities, said this week on Bloomberg TV. Interest-rate volatility should “remain quite high, at least through the mid-point of next year, perhaps further as the Middle East sorts itself out” and until the market gets more clarity on the Fed.
Growing US debt issuance has help lift the so-called term premium by more than a percentage point over the past three months, fueling a dramatic ascent in long-end rates. Traders are already bracing for the Treasury to announce further increases to auction sizes at its next quarterly refunding on Nov. 1.
“Volatility is begetting more volatility,” said William Marshall, head of US rates strategy at BNP Paribas SA. “There is just a general lack of strong conviction at this stage as to where things ought to be anchored.”
What is driving yields higher?
Via Edward Jones:
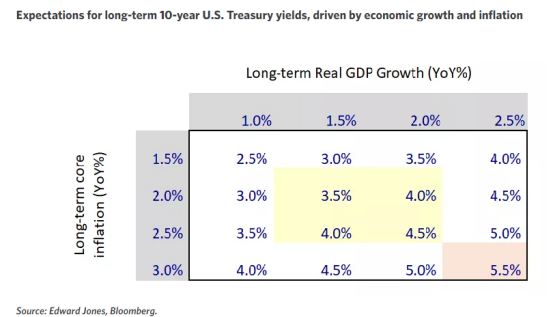
1. A resilient economy — Clearly, the U.S. economy has defied calls for recession this year, maintaining an above-trend growth rate for the first three quarters of the year. Third-quarter real GDP growth is expected to be around 3% annualized, well above trend growth of 1.5% to 2%, driven in large part by a resilient labor market and a strong consumer.*
The stronger-than-expected growth puts some upward pressure on Treasury yields as well, as yields partly reflect the growth prospects of the economy over time. However, we would expect some potential economic cooling in the quarters ahead, particularly as the labor market perhaps softens and consumption cools, driven by lower savings rates and higher debt levels overall. This moderation may also alleviate the ongoing upward pressure on Treasury yields.
2. Supply/demand imbalances — Given the growing U.S. fiscal deficit, the Treasury Department has been increasing its auction sizes for U.S. Treasury bills and notes, adding more government bonds to the market. This year, for example, the total amount of Treasuries issued in auctions is expected to climb to over $3 trillion, higher than at any year over the past decade (excluding the 2020 pandemic surge). Forecasts call for this figure to increase next year.
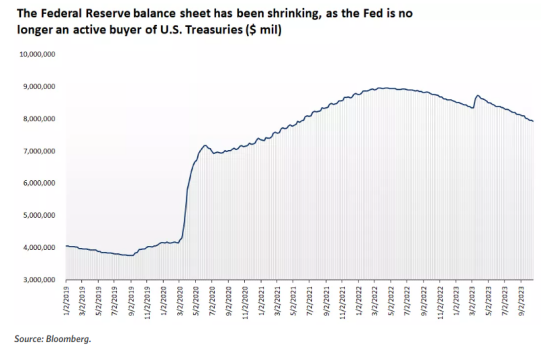
Meanwhile, some of the natural demand for these bonds has moderated. The Federal Reserve is undertaking quantitative tightening, allowing Treasury bonds to roll off its balance sheet and reducing its holding of Treasuries by about $650 billion over the last year. Some foreign buyers, such as China, have slowly been reducing their holdings of U.S. Treasuries as well, although other countries have stepped up their purchases as yields have risen, offsetting the reductions. But overall, with growing supply and waning demand, Treasury yields have increased, in part to attract more buyers.
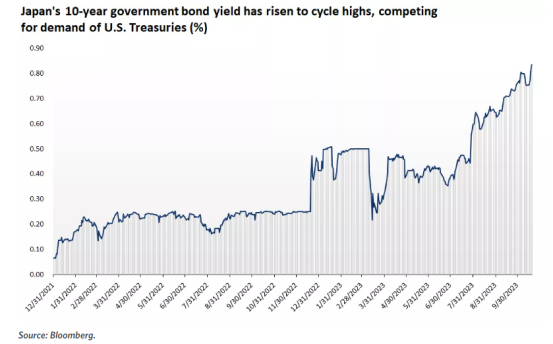
3. Global central banks raising rates — Perhaps another reason for the rise of the 10-year yield has been the rise in the yields of other major economies. For example, Japanese yields have risen to the highest levels since 2012, making them once again attractive for domestic buyers. Historically, Japan has been the largest foreign holder of U.S. Treasuries, and the rise in its own government bond yields could crowd out some demand for U.S. government bonds.
COMMENTS: This rapid move has caused increased volatility not only in the bond market, but equities as well. Although this may continue in the short term, its should normalize as central banks pause hikes, an perhaps pivot. Federal Reserve’s Bostic is a voting member next year and this week he signaled that perhaps the Fed would be cutting rates the second half of 2024. (why I like TLT call spreads in either Sept or Dec)
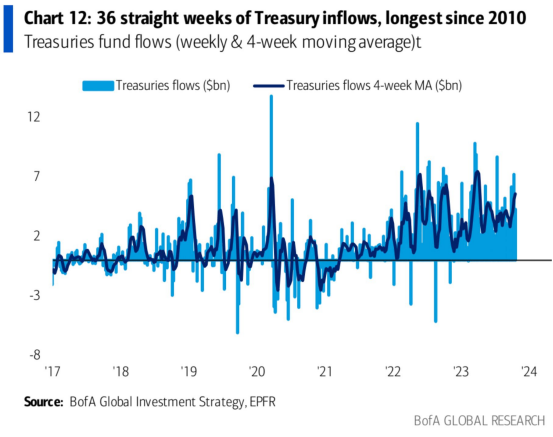
What is also notable, is that that we have seen 36 straight week of treasury inflows according to Bank of America.
WHY WEAKNESS IN SPX IS DIFFERENT THIS TIME
My good friend Russel Rhoads (CBOE Veteran and author of Trading VIX Derivatives, THE textbook in the space) wrote an excellent piece yesterday:
There have been a few weeks this year where the S&P 500 (SPX) has dropped more than 2% on a weekly basis four times since August with this past week being the fourth. Many of us that have been around the markets for a long time know to ignore the phrase, “this time is different”. However, here it is, this past week was different and the difference The difference was VIX, which closed with a 17 handle the last three weeks where SPX lost more than 2%. VIX closed above 20 this past week which indicates more volatility is expected as opposed to the other three observations where VIX just sort of shrugged of the SPX move. We did see a “VIX is broken” headline early this week, VIX at 21.71 after a 2%+ drop shows that VIX is not broken. Also, the other three 2% drops with VIX at much lower levels were followed by a week where SPX did not move more than 1%.
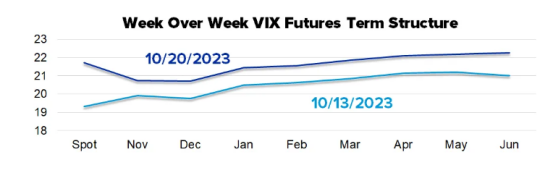
October VIX went off the board this past Wednesday which promotes November to the front month. Note the curve moved into backwardation on the short end. Sticking with the theme that this past week was different than the other 2% weekly drops, the curve was in contango each of those 2% drop weeks. Now it is in backwardation.
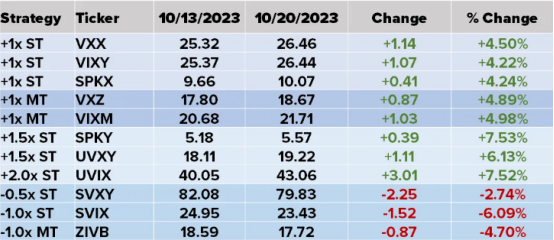
The VIX related ETPs behaved as they should with VIX higher, but November taking over as the front month had a dampening effect on the performance. UVIX remained in the 40’s after the reverse split a couple of weeks ago. SVIX continues to feel the pain of higher expected volatility dropping just over 6% on the week.
COMMENTS: For those that are in the Place Your Trades discord room, note that I mentioned this last week.
VIX backwardation signals that near-term market conditions have more uncertainty than the longer term and hedging becomes more expensive (from a volatility standpoint) in the short term.
Backwardation happens less than 20% of the time
When the VIX futures curve does go into backwardation it could signal weakness and overall risk in the market but the market can recover quickly. Examples of when this has occurred include the financial crisis in 2008, the European debt crisis in 2011, and more recently the Q4 2018 selloff that saw markets down for three straight months and then the start of the global pandemic in 2020. Shorting the market during those times may have worked out well but again, those gains may be given back rather quickly as some of the very best periods of stock market performance are immediately following some of the biggest selloffs.
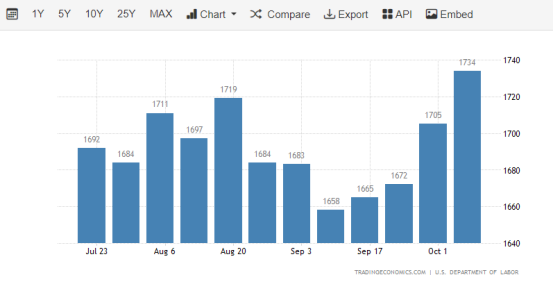
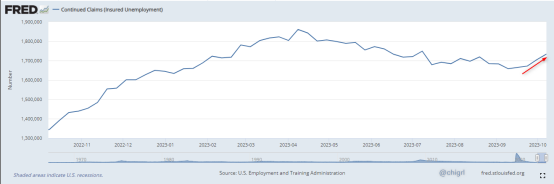
UNEMPLOYMENT DATA
COMMENTS: Unemployment claims and continuing claims came in this week on October 19th. What got A LOT of press was the decline in new claims 198K vs 211K expected. That said what did not get a lot of press was the fact that continuing claims are rising again. This is notable as far as the Fed is concerned.
AUTO LOANS
Something to keep an eye on:
Car Owners Fall Behind on Payments at Highest Rate on Record
Americans are falling behind on their auto loans at the highest rate in nearly three decades.
With interest rate hikes making newer loans more expensive, millions of car owners are struggling to afford their payments. It’s a clear indication of distress at a time when the economy is sending mixed signals, particularly about the health of consumer spending.
The percent of subprime auto borrowers at least 60 days past due on their loans rose to 6.11% in September, the highest in data going back to 1994, according to Fitch Ratings. In April that figure slipped from a previous high of 5.93% in January. But after burning through tax returns, contending with a shakier job market and grappling with still-elevated inflation, more car owners have become delinquent.
Behind the surge is both higher car prices and borrowing costs. And with the Federal Reserve indicating it plans to keep rates higher for longer, the problem is likely to persist, especially as millions of Americans recently started paying their federal student loans again via Bloomberg
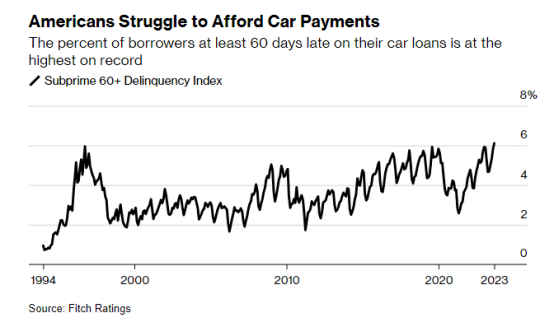
COMMENTS: Easy money from the Fed in 2020 is coming home to roost. The inherent dangers of people that paying over 10K MSRP with subprime interest rates skyrocketing and dealerships encouraging these loans by handing them out like chicklets is taking hold. Keep an eye on this.
S&P 500 EARNINGS SCORECARD …SO FAR
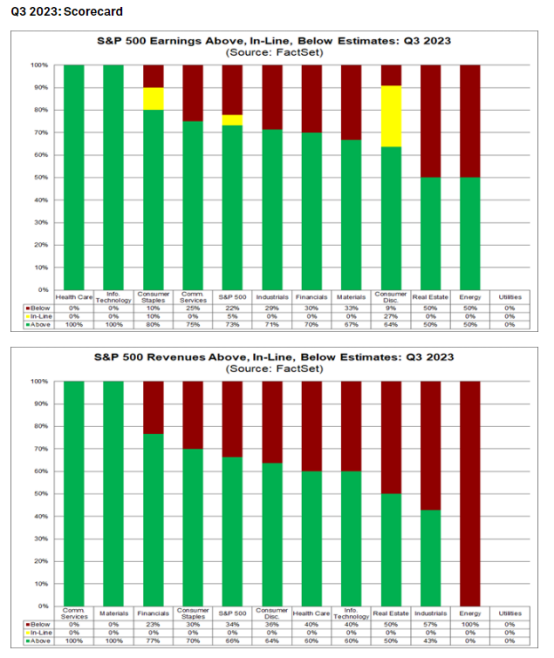
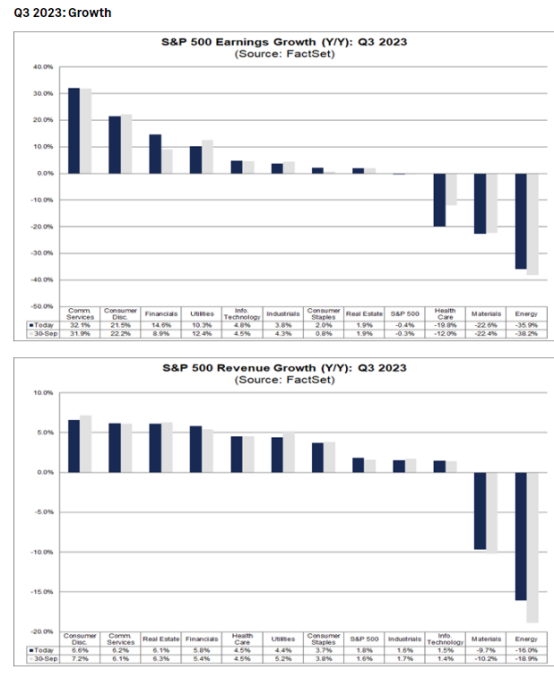
Eight of the 11 sectors are reporting (or are expected to report) year-over-year earnings growth, led by the Communication Services, Consumer Discretionary, and Financials sectors. On the other hand, three sectors are reporting a year-over-year decline in earnings: Energy, Materials, and Health Care.
In terms of revenues, 66% of S&P 500 companies have reported actual revenues above estimates, which is below the 5-year average of 68% but above the 10-year average of 64%. In aggregate, companies are reporting revenues that are 0.7% above the estimates, which is below the 5-year average of 2.0% and below the 10-year average of 1.3%.
The blended revenue growth rate for the third quarter is 1.8% today, compared to a revenue growth rate of 1.9% last week and a revenue growth rate of 1.6% at the end of the third quarter (September 30).
Upward revisions to revenue estimates for companies in the Energy sector have been the largest contributor to the increase in the overall revenue growth rate for the index since the end of the quarter.
If 1.8% is the actual revenue growth rate for the quarter, it will mark the 11th consecutive quarter of revenue growth for the index.
Nine sectors are reporting (or are projected to report) year-over-year growth in revenues, led by the Consumer Discretionary sector. On the other hand, two sectors are reporting a year-over-year decline in revenues: Energy and Materials.
Looking ahead, analysts expect (year-over-year) earnings growth of 6.7% for Q4 2023. For CY 2023, analysts predict (year-over-year) earnings growth of 0.7%. For CY 2024, analysts are calling for (year-over-year) earnings growth of 12.2%.
The forward 12-month P/E ratio is 17.7, which is below the 5-year average (18.7) but above the 10-year average (17.5). It is also below the forward P/E ratio of 17.8 recorded at the end of the third quarter (September 30).
During the upcoming week, 160 S&P 500 companies (including 12 Dow 30 components) are scheduled to report results for the third quarter.-FactSet
COMMENTS: Obviously it is still early in the earnings season, so I will update this weekly.
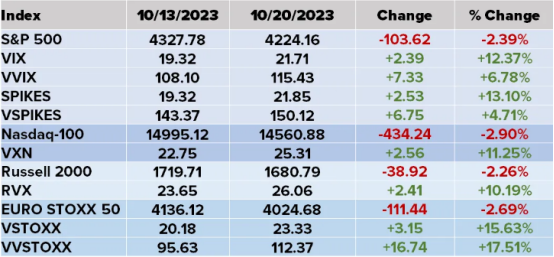
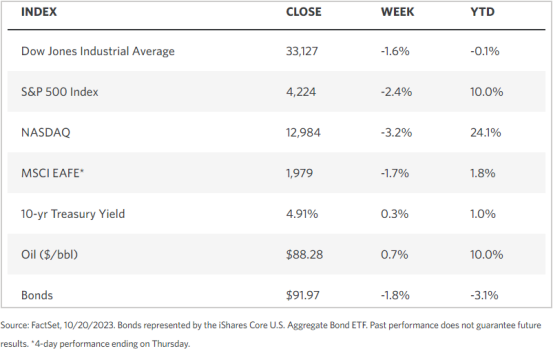
WEEKLY MARKET STATS
TECHNICALS
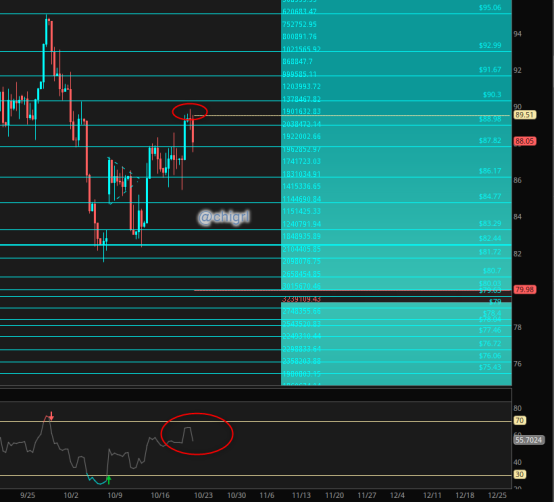
CRUDE OIL
We are still working off overbought territory nicely, this says to me we still have not reached a point where we see a meaningful pullback.
That said, this market continues to to be governed by geopolitical risks, so expect continued volatility until we see some relative calm.
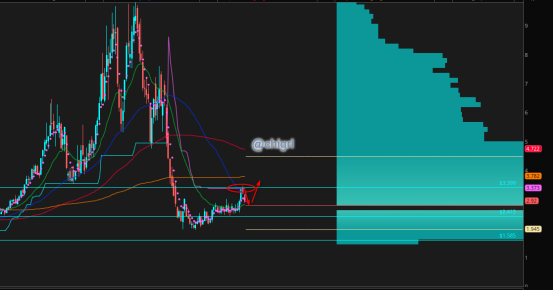
NAT GAS
This market is out of consolidation, on August 20th I noted: If you are a long term investor, might not be a bad time to start a position here as I think that this winter will be much different than last for Europe due to El Nino. (I still like this play)
Last week I noted that we hit a big resistance area and were likely to see a pullback and that we did.
I will be looking for a bounce around 2.8 (this could come in slightly above that)
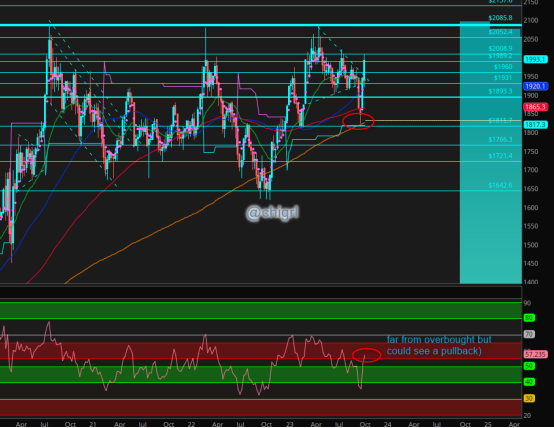
GOLD
Hard to believe it was only two weeks ago when I noted that gold hit a technical support area just as geopolitical risk was taking off. Since then we have rallied over $100
This week we did hit that ~ $2000 psychological level that everyone is watching. That said we are still far from overbought, though we could see a pullback.
Again this market is also hyper sensitive to geopolitical risk right now, I would not be surprised at another attempt at that multi-year triple top
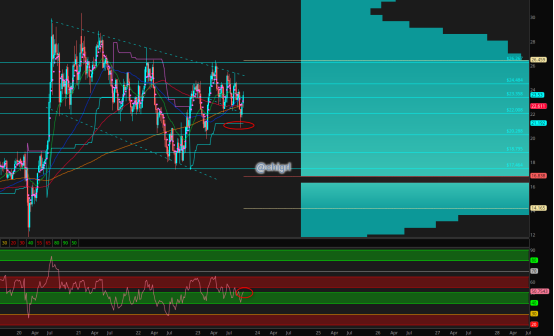
SILVER
Silver also held weekly support and is still trading in a a bullish flag withing an even larger bullish pattern.
The fundamentals as well remain strong.
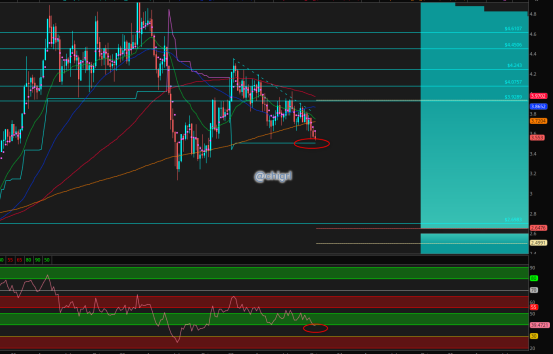
COPPER
China is buying copper like mad, an no one is noticing as their EV production grows.
Technically speaking watch that 3.5 weekly support area. We are getting oversold as well.
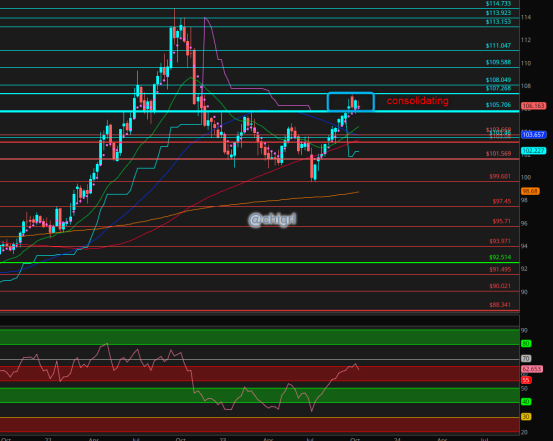
USD $DXY
Still consolidating …Yellen is going to have to reign this in soon or it will further crush EM’s
Financial Disclaimer: This material has no regard for specific investment objectives, financial situations, or particular needs of any user. This material is presented solely for informational and entertainment purposes and is not to be construed as a recommendation, solicitation, or an offer to buy or sell / long or short any securities, commodities, or any related financial instruments. Nor should any of its content be taken as investment advice. The views expressed here are completely speculative opinions and do not guarantee any specific result or profit. Trading and investing are extremely high risk and can result in the loss of all of your capital. Any opinions expressed here are subject to change without notice. We may have an interest in the securities, commodities, and/or derivatives of any entities referred to in this material. We accept no liability whatsoever for any loss or damage of any kind arising out of the use of all or any part of this material. We recommend that you consult with a licensed and qualified professional before making any investment or trading decisions.