ALL EYES ON FOMC THIS WEDNESDAY
Stocks entered correction territory last week, down about 10% from their peak in late July
Is this is a mere correction….or something more?
Edward Jones seems to think this is a buying opportunity:
Without dismissing the risks, we offer 10 reasons why the recent pullback in stocks and bonds may present an opportunity for investors to add quality investments at lower prices ahead of a potential rebound.
Let us take a look at their reasonings with my comments as we break it all down:
1. The economy remains resilient
- According to the government’s preliminary estimate, the U.S. economy grew at a 4.9% annual pace in the third quarter, ahead of estimates and more than double the second-quarter pace. The strong growth was driven by consumer spending, which remains the economy’s workhorse. Government spending aided growth for the fifth straight quarter, while housing rebounded, posting its first quarterly increase in more than two years.
- We don’t think that the economy can continue growing at the same pace, and, in fact, we think that it is likely that we may go through a soft patch in the coming quarters. High borrowing costs will soon have an impact on the consumer, and spending is unlikely to keep growing faster than disposable income, now that excess savings are mostly depleted. Yet, we don’t think that growth will fall off a cliff either. A still-strong labor market and solid consumer finances relative to history will support consumer spending for a while longer.
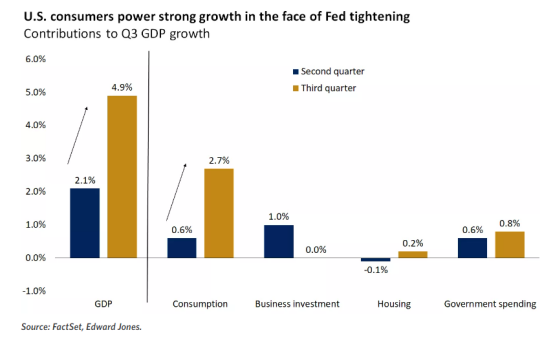
COMMENTS: Increased consumer spending came from housing and utilities, health care, financial services and insurance, and food (meaning rising costs for necessities) The rest came from state and local government spending, federal government spending, and residential fixed investment (so mostly government spending…you wonder why our deficit is so high..and housing). Personal savings rate and real disposable income were down. Yes, the consumer is hurting.
So, I have to disagree with them a bit here.
2. Inflation continues to moderate
- Despite stronger-than-expected growth and low unemployment, inflation remains on a downward path. The core personal consumption expenditures (PCE) price index, which is the Fed’s preferred measure of inflation, ticked down to 3.7% in September from 3.8% in the prior month. That is still way above the Fed’s 2% target but significantly below last year’s 5.6% peak1. We think that the deceleration in wage growth and lower housing inflation will drive further improvement in the quarters ahead.
COMMENTS: I am in the sticky inflation camp with elevated energy prices, as energy affects everything on the bottom line for all business. So, disagree with the deflation stance.
3. The Fed is preparing to end its rate hikes
- At this week’s meeting the Fed is expected to keep interest rates unchanged, as the recent surge in long-term bond yields is helping convince policymakers that there is less need for further hikes. While the Fed will likely keep all options open, it is possible that the July hike might have been the last of this tightening cycle. Historically, a Fed pause has been positive for markets, with stocks rising strongly in five instances between the last hike and the first cut, while declining only modestly in two cases (1987 and 2001). Bonds achieved above-average returns in six of the seven instances
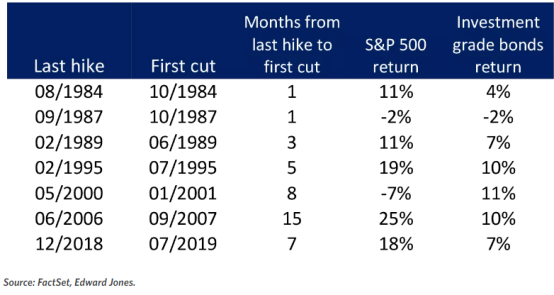
COMMENTS: I do agree with this. The Fed has also been painting themselves in the “pause corner” over the last three week with rhetoric.
4. Bond yields are potentially peaking
- The surge in the 10-year Treasury yield to 5%, a 16-year high, has pressured both equity valuations and bond prices.. While the exact time is hard to pinpoint, we think that yields might be approaching a cyclical peak as economic growth slows, the Fed pivots to rate cuts in 2024, and inflation gets closer to the Fed’s 2% target.
COMMENTS: Everyone and their mother has been trying to get long US Treasury market and bonds keep tanking.
5. Valuations have improved
- The recent pullback in stocks has brought the S&P 500 price-to-earnings ratio (based on next 12-month earnings estimates) down to 17.4 from 191. While on the surface valuations are not cheap relative to current bond yields, many segments of the equity market trade at deeper discounts. For example, the S&P 500 Equal Weighted Index trades at 14 times earnings, and value style-investments, as proxied by the Russell 1000 Value index, trade at 13 times earnings, vs. the “Magnificent Seven” at 30 times.
- In fixed income, the upside of the historic decline in bonds is that yields are now attractive and therefore are likely to produce high returns. The larger income component can better offset price declines, and because of that, a 1% decline in rates would potentially translate to a much larger upside in prices than the downside from an equivalent 1% rise in rates.
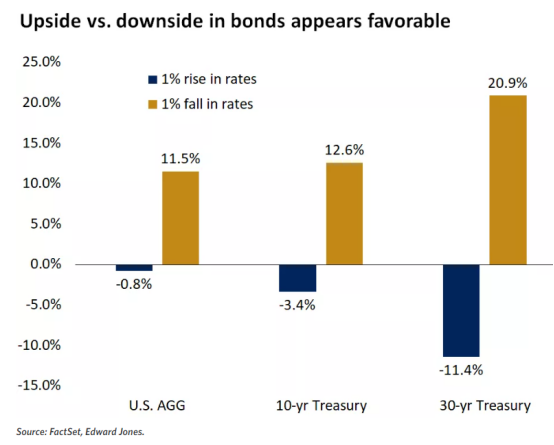
COMMENTS: I literally just talked about this with Jim Bianco last week on the PYT spaces, I encourage you to listen to it if you missed it, its is in the PYT home page right now.
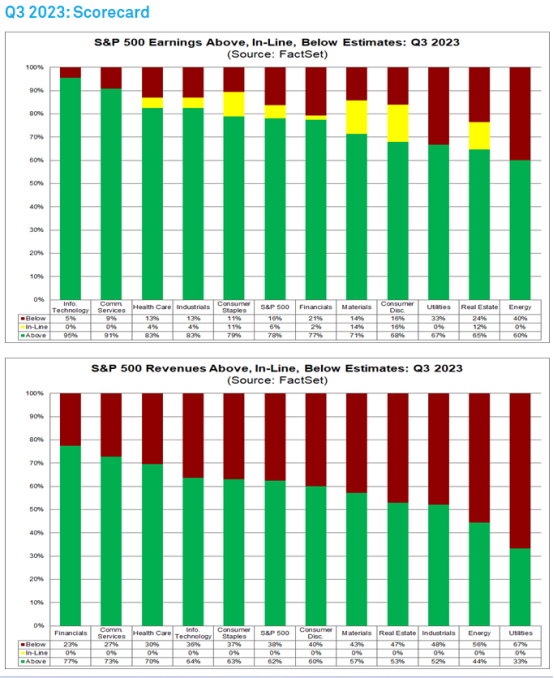
6. Earnings are rebounding
- After three consecutive negative quarters, corporate profits are on track to return to growth in the third quarter and are expected to improve further through 2024. Solid demand is driving a reacceleration in revenue growth, while the decline in material and input costs is likely to help profitability rebound. We think that analyst estimates calling for 12% growth next year might prove overly optimistic. Nonetheless, in contrast to last year when profits declined, rising earnings will likely support rising stock prices.
Comments: This is true, but so far the markets seem to be discounting this fact.
Via FactSet:
At the mid-point of the Q3 earnings season for the S&P 500, both the number of positive earnings surprises and the magnitude of these earnings surprises are above their 10-year averages. As a result, the index is reporting higher earnings for the third quarter today relative to the end of last week and relative to the end of the quarter. The S&P 500 is now reporting year-over-year growth in earnings for the first time since Q3 2022. Overall, 49% of the companies in the S&P 500 have reported actual results for Q3 2023 to date. Of these companies, 78% have reported actual EPS above estimates, which is above the 5-year average of 77% and above the 10-year average of 74%. In aggregate, companies are reporting earnings that are 7.7% above estimates, which is below the 5-year average of 8.5% but above the 10-year average of 6.6%. Historical averages reflect actual results from all 500 companies, not the actual results from the percentage of companies that have reported through this point in time.
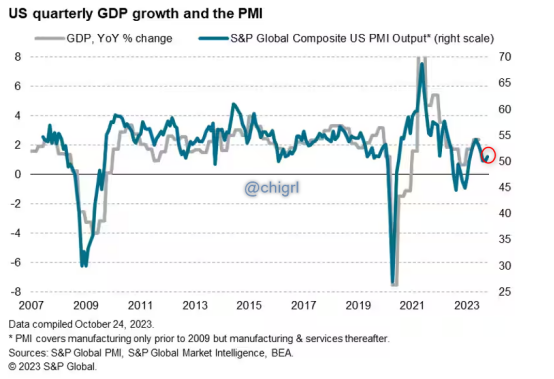
7. Signs that the worst in manufacturing activity is over
- Manufacturing activity has been in contraction for most of the past year. But the S&P Global PMI survey released last week returned to expansion territory in October and appears to be curving out of a bottom. While manufacturing is a much smaller part of the economy relative to services, it is an important signal, as it tends to indicate potential inflection points in the economy.
COMMENTS: Just barely…but true
Via S&P Global:
Key findings: Flash US PMI Composite Output Index (1) at 51.0 (September: 50.2). 3-month high.
Flash US Services Business Activity Index(2) at 50.9 (September: 50.1). 3-month high.
Flash US Manufacturing Output Index(4) at 51.1 (September: 50.8). 6-month high. Flash
US Manufacturing PMI (3) at 50.0 (September: 49.8). 6-month high.
8. Increase in oil prices remains contained
- Heightened geopolitical uncertainty briefly pushed WTI oil above $90 a barrel on fears that supply might be disrupted. However, prices have now subsided slightly below last year’s, meaning that energy will be a neutral to slightly negative influence on the October inflation reading
COMMENTS: This is a wild card, I would not lean on this.
- Too much geopolitical risk right now
- WTI-Cushing (the actual WTI contract that you are all trading)… Fundamental disconnect via BTU FactSet (note I have literally been talking about this for months) Unlike in 2022, the price of WTI is below where BTU Analytics currently calculates it could be, pointing to a disconnect between price and fundamentals. As stated earlier, the price of WTI did move up in September when Cushing stocks first moved below 22 MMbbls, but corrected and increased, albeit temporarily, following the conflict in Israel that began on October 7, 2023. If comparing the price point for WTI to when the EU banned Russian crude, at current Cushing storage levels, and running a simple correlation exercise, WTI should be trading closer to $105/bbl. On October 25, 2023, the EIA reported a 213-Mbbl build at Cushing, likely due to reported outages at the Osage and Cushing South pipelines, which also limited export opportunities. Nine of the last 11 weeks have seen draws in Cushing inventories, and refining utilization is still down. All of this points to inventory levels remaining close to operational minimums for the near-term.
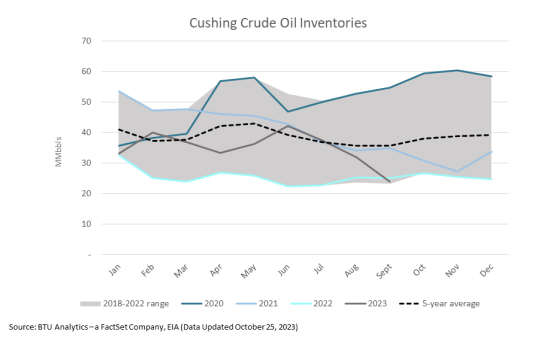
Let us see how much longer, oil prices will be disjointed from reality.
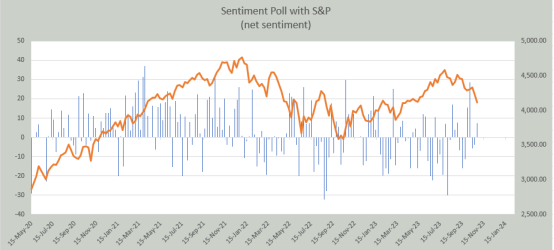
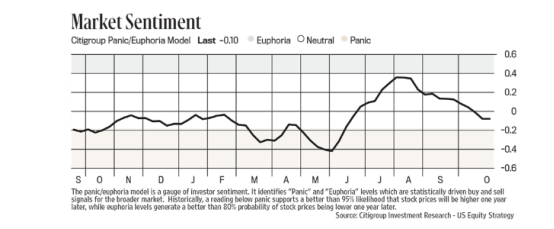
9. There is less investor complacency
- While sentiment among investors was very positive and in cases euphoric during the summer months amid enthusiasm around AI and stronger growth, the mood has turned darker as of late. These swing in emotions are reflected in the AAII Investor Sentiment Survey, which was showing a bulls-to-bears ratio of 2 in July vs. a 0.68 ratio currently. Sentiment tends to be a contrarian indicator, as complacency usually leads market corrections, while skepticism provides the fuel for equities to climb the proverbial wall of worry.
COMMENTS: We have not reached peak bearishness *yet* imho.
Proof of concept:
10. Seasonal factors turn positive in November and December
- Fundamental conditions drive market returns, not the calendar. But history shows that there are some seasonal patterns to returns that can be observed over time. Since 1945, November and December tend to be good months for stocks, with the S&P 500 achieving above-average gains and the highest chances of positive returns.
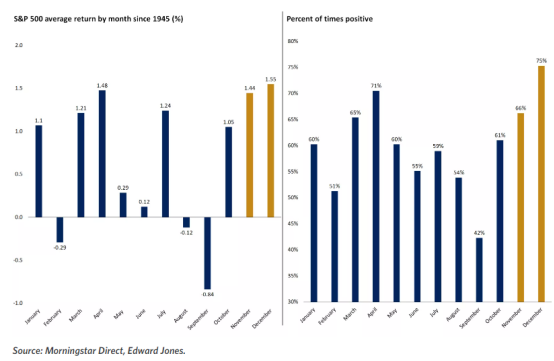
COMMENTS: This is true, there an old saying markets reach famine on Thanksgiving and feast on Christmas.
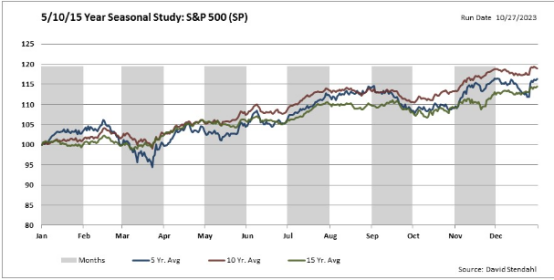
5/10/15 year seasonal study on the S&P 500
What the Federal Reserve portrays this week will also be monumentally important heading into the end of the year.
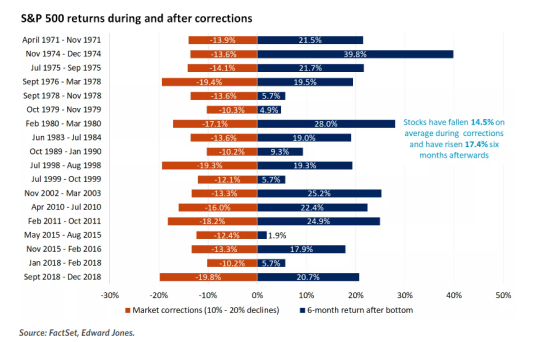
CORRECTION TERRITORY STATS
Stocks entered correction territory last week, down about 10% from their peak in late July S&P 500 returns during and after corrections
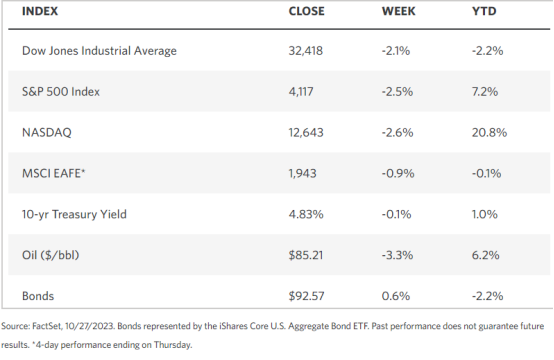
WEEKLY MARKET STATS
TECHNICALS
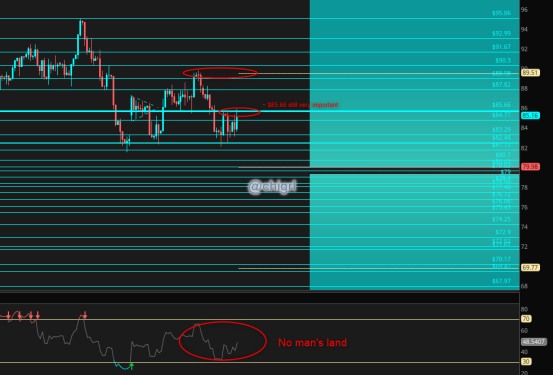
Crude Oil
Last week I noted: We are still working off overbought territory nicely, this says to me we still have not reached a point where we see a meaningful pullback.
That said, this market continues to to be governed by geopolitical risks, so expect continued volatility until we see some relative calm.
Fundamentally I remain bullish over the long term, but trading wise, we are in no mans land…there is no edge here so to speak
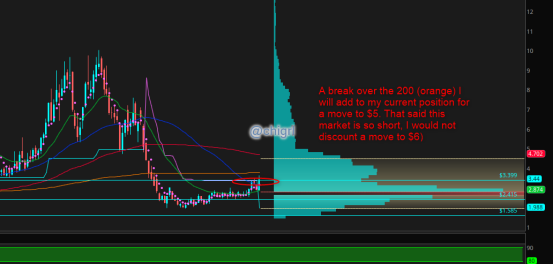
Nat Gas
Last week I noted: This market is out of consolidation.
On August 20th I noted: If you are a long term investor, might not be a bad time to start a position here as I think that this winter will be much different than last for Europe due to El Nino. (I still like this play)
Looking at Feb/March call options (NG or UNG)
I am long CHK and LNG ..for this play in my longer term equity portfolio
Gold
Same as last week:
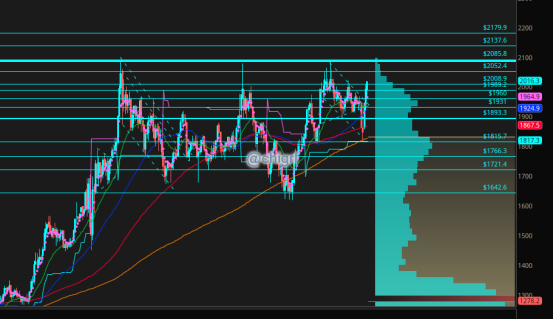
Gold
Hard to believe it was only two weeks ago when I noted that gold hit a technical support area just as geopolitical risk was taking off. Since then we have rallied over $100
This week we did hit that ~ $2000 psychological level that everyone is watching. That said we are still far from overbought, though we could see a pullback.
Again this market is also hyper sensitive to geopolitical risk right now, I would not be surprised at another attempt at that multi-year triple top
*Be sure to listen to the PYT spaces this week as we are going to tackle gold this week (11 AM ET on X spaces)
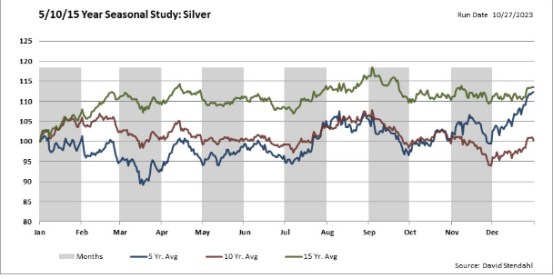
Silver
Silver also held weekly support and is still trading in a a bullish flag withing an even larger bullish pattern.
The fundamentals as well remain strong.
I will say this is a much harder trade than other metals.
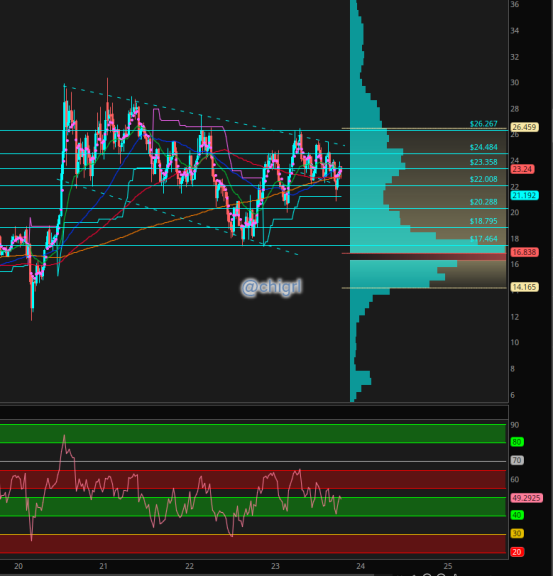
Perhaps a better way to look at this market is seasonality…seasonally, this market tends to bottom at the end of November and rally in December
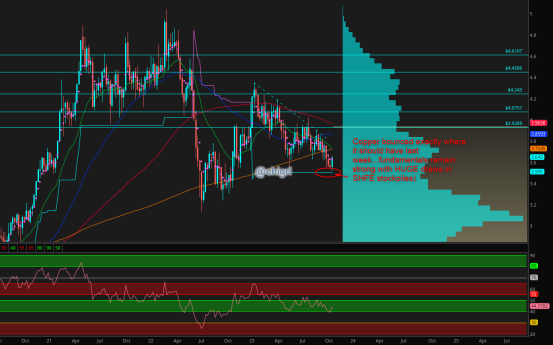
Copper
Last week I noted: China is buying copper like mad, an no one is noticing as their EV production grows.
Technically speaking watch that 3.5 weekly support area. We are getting oversold as well.
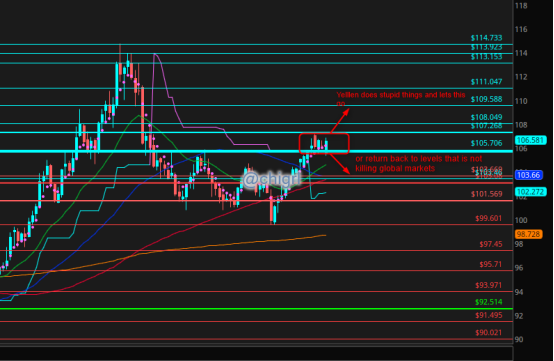
USD $DXY
Financial Disclaimer: This material has no regard for specific investment objectives, financial situations, or particular needs of any user. Nor should any of its content be taken as investment advice. The views expressed here are completely speculative opinions and do not guarantee any specific result or profit. Trading and investing are extremely high risk and can result in the loss of all of your capital. Any opinions expressed here are subject to change without notice. We may have an interest in the securities, commodities, and/or derivatives of any entities referred to in this material. We accept no liability whatsoever for any loss or damage of any kind arising out of the use of all or any part of this material. We recommend that you consult with a licensed and qualified professional before making any investment or trading decisions.